





What Is Total Value Locked?
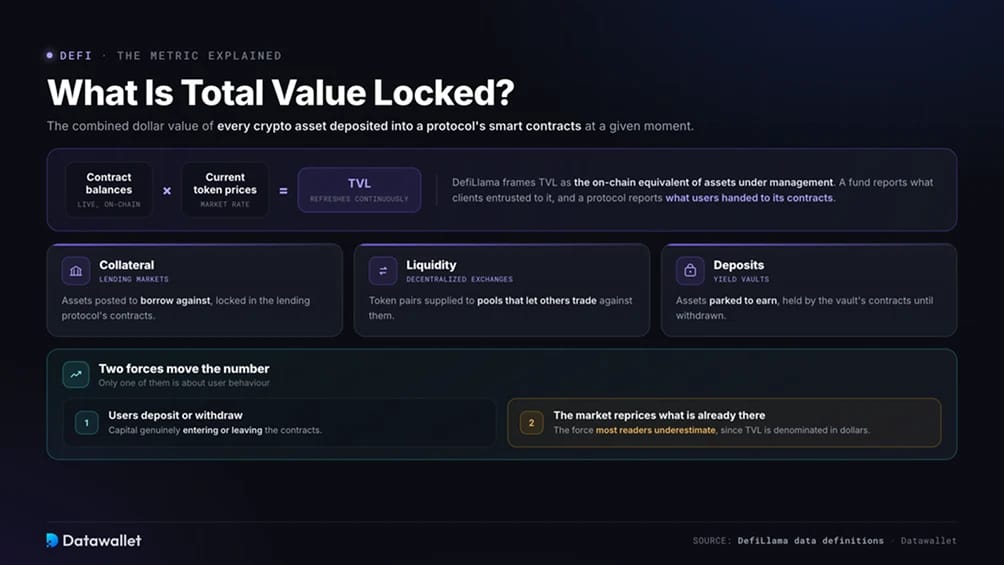
Total value locked is the combined dollar value of every crypto asset deposited into a protocol's smart contracts at a given moment. Those deposits might be collateral in a lending market, liquidity in a decentralized exchange pool, or assets parked in a yield vault.
DefiLlama, the aggregator supplying the data in the table above, frames TVL as the on-chain equivalent of assets under management. A fund reports what clients have entrusted to it, and a protocol reports what users have handed to its contracts.
Because it derives from live contract balances multiplied by current token prices, the figure refreshes continuously. Two forces move it. Users deposit or withdraw, and the market reprices whatever they deposited earlier. That second force is the one most readers underestimate.
How TVL Is Calculated
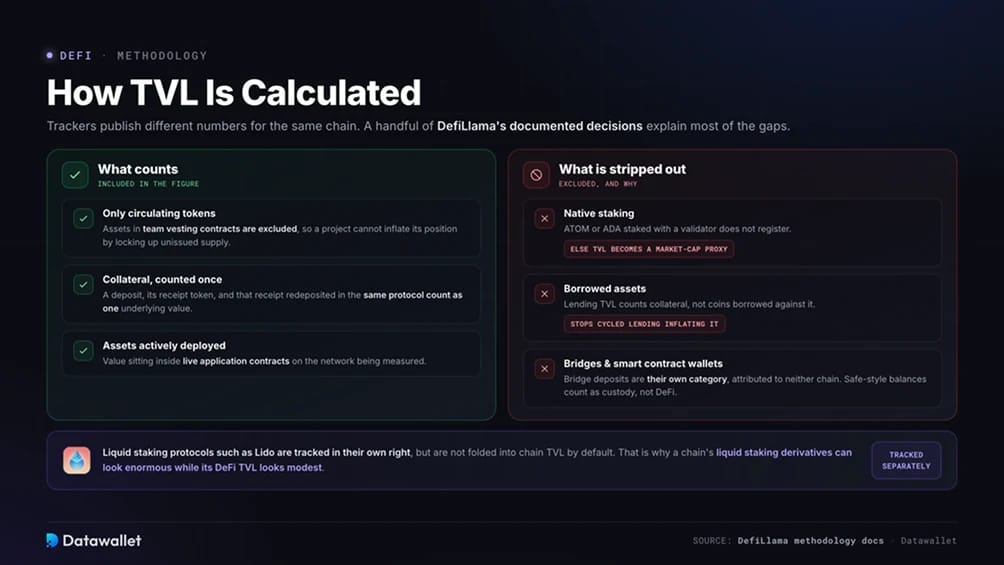
Different trackers publish different numbers for the same chain, which confuses anyone comparing sources. DefiLlama documents its methodology openly, and a handful of its decisions explain most of the gaps you will encounter.
- Only circulating tokens count: Assets held in team vesting contracts are excluded, so a project cannot inflate its position by locking up unissued supply.
- No double counting inside a protocol: If a user deposits a token, receives a receipt token, and redeposits that receipt elsewhere in the same protocol, the underlying value is counted once.
- Native staking sits outside chain totals: ATOM securing the Cosmos hub or ADA staked with a validator does not register as TVL. Without this rule, chain TVL would become a proxy for token market cap and tell you almost nothing about DeFi usage.
- Borrowed assets are stripped out: Lending TVL counts collateral locked in contracts, not coins borrowed against it. That exclusion exists specifically to stop cycled lending from inflating the headline.
- Bridges are tracked separately: Bridge deposits are counted as their own category and are not attributed to either the origin or destination chain.
- Smart contract wallets are excluded: Balances held in Safe or similar wallets are treated as custody rather than DeFi participation.
Liquid staking protocols such as Lido are tracked in their own right but are not folded into chain TVL by default, which is why a chain's liquid staking derivatives can look enormous while its DeFi TVL looks modest.
Why TVL Matters
TVL earns its place because it answers a question no price chart can. It tells you how much capital is willing to sit inside a set of smart contracts and accept the risk that comes with them.
- Liquidity depth: Deep pools mean large orders can be filled without heavy slippage. A trader moving size on a chain with thin TVL will pay for that thinness in execution quality.Comparability:
- Comparability: Because DefiLlama applies one standard across hundreds of networks, TVL lets you compare a Cosmos appchain to an Ethereum rollup without rebuilding the analysis each time.Revealed preference:
- Revealed preference: Deposits carry real risk, so they are a costlier signal than social activity or transaction counts. Capital that stays through a drawdown says something that wallet counts do not.Stress detection:
- Stress detection: Sharp single-day declines usually indicate withdrawals rather than price moves. That divergence is one of the earliest public warnings that something has broken.
What Happened to DeFi TVL This Year
The sector opened January with roughly $114.5 billion locked and contracted in every subsequent month, reaching a low near $69.3 billion in late June before recovering toward $74 billion in early July. That is a decline approaching 40% in half a year.
Price did much of the damage. Bitcoin fell more than 50% from its October 2025 peak, and since TVL is denominated in dollars, a falling market shrinks the number even when no one withdraws a token. The deleveraging that began with the October 10 liquidation event removed the borrowed capital that had padded totals through the previous cycle.
Security failures did the rest. Drift Protocol lost roughly $286 million on 1 April, and on 18 April attackers drained about 116,500 rsETH, worth around $292 million, from KelpDAO's LayerZero bridge. The stolen tokens were unbacked, and the attacker posted them as collateral on Aave V3 to borrow wrapped ether.
Aave's own contracts were never compromised, yet the consequences landed there anyway. Its rsETH markets were frozen, depositors withdrew en masse, and CoinDesk reported roughly $196 million in bad debt concentrated in one collateral pair.
Aave TVL fell from $26.4 billion on 18 April to about $14.6 billion a month later. Total DeFi TVL dropped $13.2 billion inside 48 hours, which remains the clearest demonstration this cycle of how fast the metric reprices trust.
Breaking the drawdown down by category shows where the pain concentrated. Liquid staking led the decline at roughly 44% year to date, followed by lending at about 39%. Real-world assets were the sole major category to grow, expanding close to 48% over the same stretch.
Which Chains Hold the Most TVL
Ethereum still anchors the sector, holding more than half of all DeFi TVL. That dominance reflects a decade of protocol accumulation, the deepest stablecoin base of any network, and the fact that most institutional deployments still settle there by default.
Beneath it the ranking has grown more varied than the old Layer 1 pecking order suggests. BSC, Solana, Tron, Base, and Bitcoin now cluster within a narrow band, and each holds its position for a different reason. Tron's base is stablecoin lending and transfers, Base draws from Coinbase distribution, and Bitcoin's figure is dominated by Babylon, which held roughly 56,850 BTC in native staking vaults as of May.
Only two chains in the top ten grew their locked value across the first half of the year. Tron added around 5%, helped by the durability of USDT balances that do not care much about market sentiment, and Hyperliquid gained close to 7% as on-chain derivatives kept taking share from centralized venues.
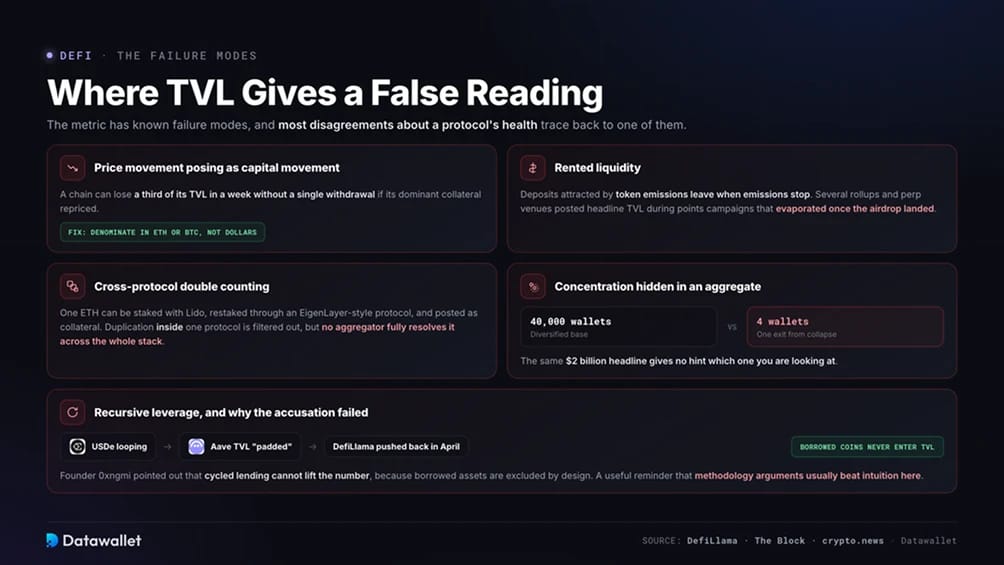
- Price movement masquerading as capital movement. A chain can lose a third of its TVL in a week without a single withdrawal if its dominant collateral asset repriced. Checking TVL denominated in ETH or BTC rather than dollars separates the two effects.Rented liquidity.
- Rented liquidity: Deposits attracted by token emissions leave when emissions stop. Several Layer 2 networks and perpetual exchanges posted headline TVL during points campaigns that evaporated once the airdrop landed, a pattern The Block documented across the 2025 rollup cohort.Cross-protocol double counting.
- Cross-protocol double counting: One ETH can be staked with Lido, restaked through an EigenLayer style protocol, and posted as collateral on a lending market. Duplication inside a single protocol is filtered out, and a double count toggle exists on the dashboard, though no aggregator fully resolves the problem across the whole stack.Recursive leverage.
- Recursive leverage: Looping strategies built around assets like Ethena's USDe drew accusations that Aave's figure was padded. DefiLlama founder 0xngmi pushed back in April, pointing out that borrowed coins never enter TVL, so cycled lending cannot lift the number. The exchange is a useful reminder that methodology arguments usually beat intuition here.Concentration hidden inside an aggregate.
- Concentration hidden inside an aggregate: A $2 billion chain TVL sourced from four wallets behaves nothing like the same figure spread across forty thousand. The headline gives no hint which one you are looking at.
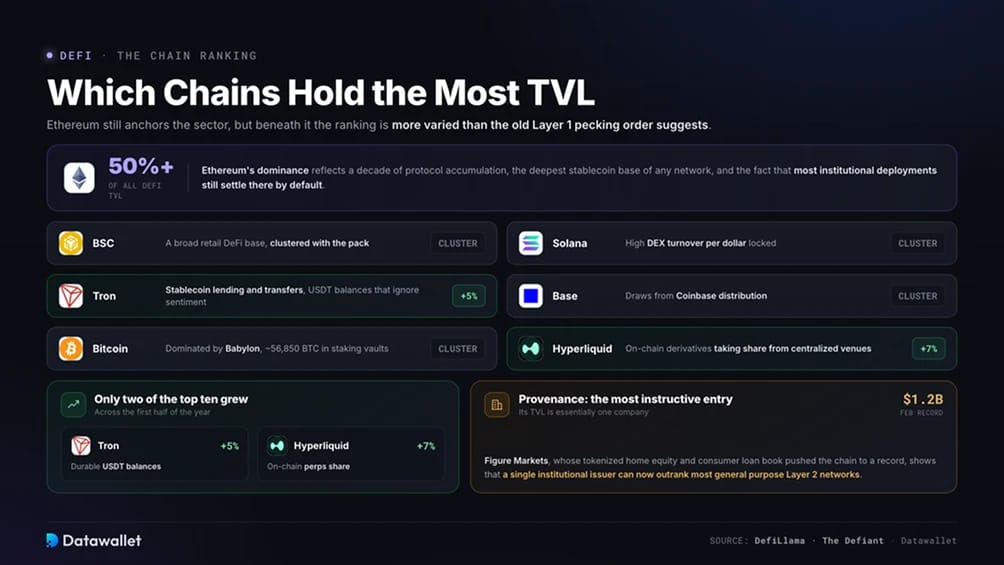
The most instructive entry is Provenance. Its TVL is essentially one company, Figure Markets, whose tokenized home equity and consumer loan book pushed the chain to a $1.2 billion record in February, according to The Defiant. A single institutional issuer can now outrank most general purpose Layer 2 networks.
Where TVL Gives a False Reading
The metric has known failure modes, and most disagreements about a protocol's health trace back to one of them.
The Metrics Analysts Pair With TVL
Serious analysis in the current market treats TVL as one input among several. Each of the metrics below answers a question TVL cannot.
- Total value secured (TVS): L2BEAT counts canonically bridged, externally bridged, and natively minted assets on a rollup, whether or not they are deployed anywhere. TVS therefore runs well above DefiLlama's TVL for the same network, and comparing the two shows how much bridged capital is sitting idle.
- Fees and revenue: Fees measure what users pay to use a protocol, and revenue measures what the protocol keeps. A venue earning steady fees on modest deposits is healthier than one holding large deposits that generate nothing.
- Volume to TVL ratio: This measures how hard each locked dollar works. Solana consistently produces higher DEX turnover per dollar locked than Ethereum, which is why it can lead daily decentralized exchange volume while ranking lower on TVL.
- Open interest: For perpetual exchanges, open interest is the closer analogue to TVL. Volume can be manufactured cheaply, whereas holding a position requires posting margin and paying funding. Hyperliquid reached a record 9.3% share of global perpetual open interest by early July, up from 6.9% in late May.
- Stablecoin supply: Stablecoin circulation reached roughly $314 billion in mid-June, about 4.4 times total DeFi TVL. Most dollar liquidity on-chain now sits outside DeFi protocols entirely, which is a structural shift rather than a temporary one.
What TVL Is Starting to Miss
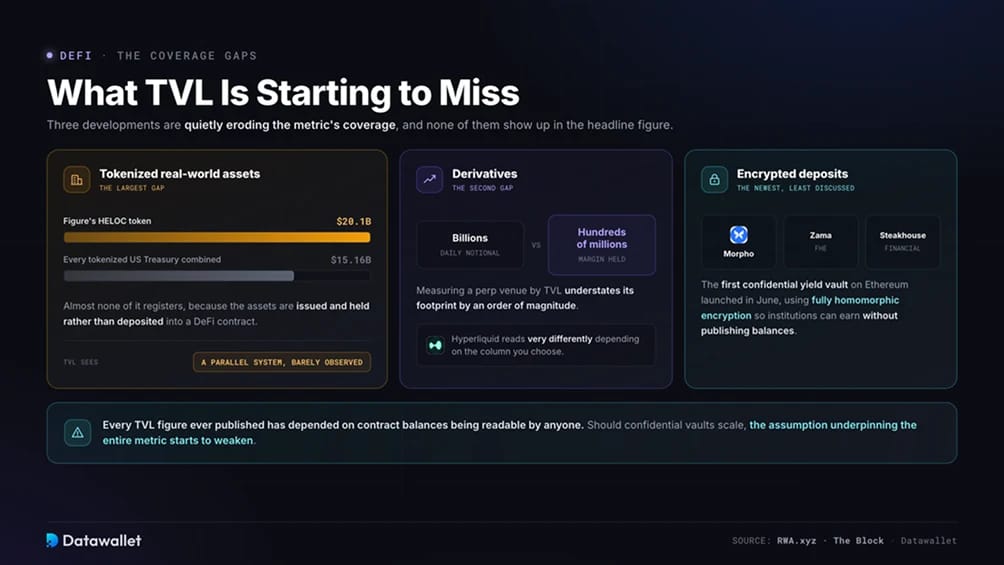
Three developments are quietly eroding the metric's coverage, and none of them show up in the headline figure.
Tokenized real-world assets are the largest gap. Figure's HELOC token reached about $20.1 billion in early July, more than every tokenized US Treasury combined at $15.16 billion, per RWA.xyz data. Almost none of that registers as TVL, because the assets are issued and held rather than deposited into a DeFi contract. The tokenization market has grown into a parallel system that the DeFi TVL chart barely observes.
Derivatives are the second gap. A perpetual exchange settling billions in daily notional volume may hold only a few hundred million in margin. Measuring it by TVL understates its economic footprint by an order of magnitude, which is why Hyperliquid's protocol statistics read very differently depending on which column you choose.
Encrypted deposits are the newest and least discussed. Zama, Morpho, and Steakhouse Financial launched the first confidential yield vault on Ethereum in June, using fully homomorphic encryption so institutions can earn without publishing balances or position sizes, as reported by The Block.
Every TVL figure ever published has depended on contract balances being readable by anyone. Should confidential vaults scale, the assumption underpinning the entire metric starts to weaken.
How We Read the Table Above
We use the table as a starting point rather than a verdict, and three habits make it far more useful.
Compare the change columns against price action over the same window. When a chain's TVL falls more than its dominant collateral asset did, real capital left. When it falls less, the market simply repriced what was already there.
Check the protocol count alongside the dollar figure. A chain with hundreds of live protocols has a diversified base, while a chain with a handful is one large depositor away from a very different ranking.
Treat sharp weekly moves as questions, not conclusions. Bitcoin's position swings on Babylon deposit windows, Provenance moves on one issuer's loan origination, and a rollup can gain a billion dollars because an incentive program opened. Knowing which mechanism is behind a move matters more than the move itself.
Final Thoughts
TVL still does one job better than any alternative. It shows, in a single comparable figure, where capital has chosen to sit and accept smart contract risk across hundreds of competing networks.
What has changed is the weight the number can carry alone. The drawdown of the past six months, the speed of the April contagion, and the migration of institutional capital into tokenized assets that TVL does not count have all narrowed its usefulness as a lone indicator.
Pair it with fees, open interest, and stablecoin supply, and it remains one of the most honest datasets in crypto. Read it in isolation, and it will mislead you at exactly the moments when accuracy matters most.
Frequently Asked Questions
What is a good TVL for a DeFi protocol?
There is no universal threshold, since a derivatives venue and a lending market convert deposits into economic activity at completely different rates. A more useful test is whether deposits persist after token incentives end and whether the protocol generates fees proportional to what it holds.
Why do DefiLlama and L2BEAT report different numbers for the same rollup?
They measure different things. DefiLlama counts assets actively deployed in applications on that network, while L2BEAT counts everything bridged to or minted on it, including tokens sitting untouched in wallets. Neither is wrong, and the gap between them tells you how much bridged capital is idle.
Does a higher TVL mean a chain is safer?
No. TVL indicates liquidity depth and capital willingness, not security. The April exploits removed billions from protocols whose own code was never compromised, which shows that concentrated collateral can transmit risk rather than absorb it.
Why is staked ETH or ADA not included in chain TVL?
Native staking secures the network rather than powering a DeFi application. Including it would make chain TVL track token market cap, since staked supply is large and its dollar value swings daily. DefiLlama tracks liquid staking protocols separately for the same reason.
Can TVL be manipulated?
Partly. Emissions can rent deposits temporarily, and undercollateralized lending pools have historically allowed borrowers to recycle funds back into the same protocol. Aggregators counter this by excluding borrowed assets and non-circulating tokens, though incentive-driven deposits remain difficult to distinguish from organic ones in real time.