


What Is the VPVR (Volume Profile Visible Range) Indicator?
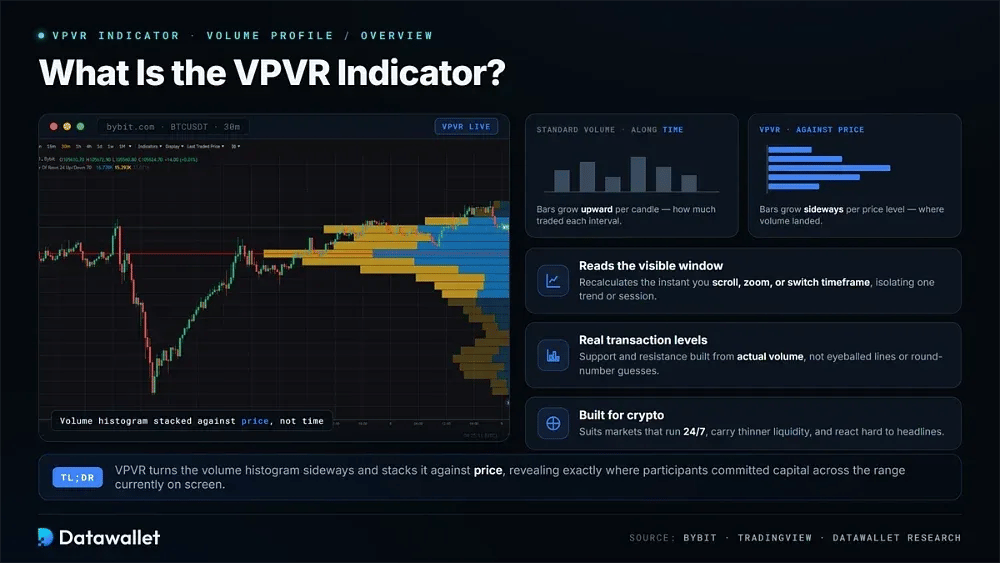
The VPVR, formally the Visible Range Volume Profile, is a study that measures how much volume changed hands at each price level within the candles currently on screen. Standard volume bars stack activity along time, whereas VPVR turns the histogram sideways and stacks it against price.
Because it reads only the visible window, the tool recalculates the moment you scroll, zoom, or switch timeframe. That behavior lets traders isolate volume for one trend, one range, or one session, surfacing support and resistance built from real transactions rather than lines drawn by eye or round-number guesswork.
Crypto suits this approach well. Markets here run around the clock, carry thinner liquidity than equities, and react hard to headlines, so entering blind is costly. Traders lean on VPVR to wait for a reaction at a heavy node, or to target the thin gaps where a breakout can run with little friction.
How to Read a VPVR Indicator Chart
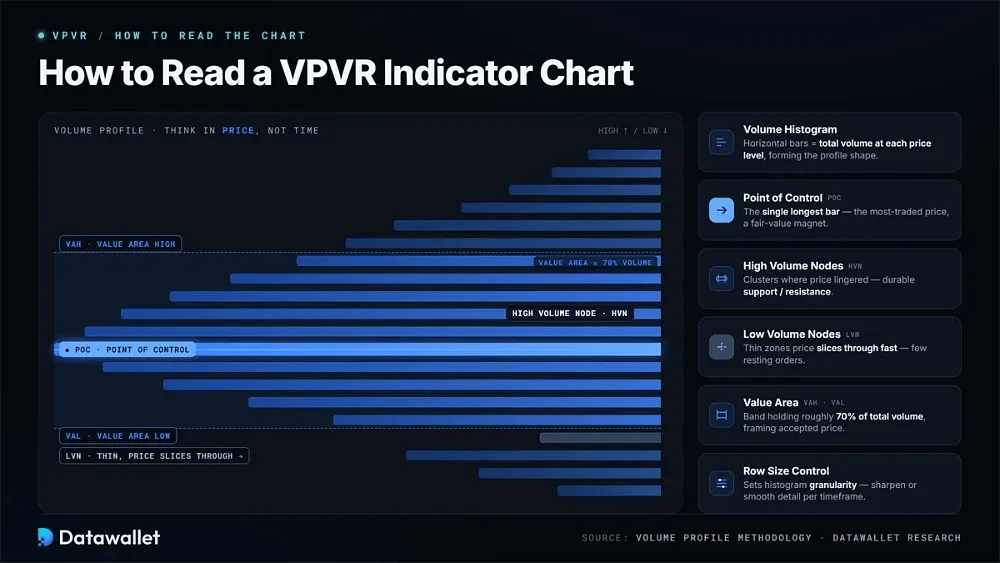
Reading VPVR means thinking in price, not time. Each element of the histogram tells you something different about where participants committed capital and how the market is likely to behave when price revisits that zone.
The core components you will work with are the following building blocks:
- Volume histogram: Horizontal bars whose length shows total volume traded at each price level across the visible range, forming the shape of the profile.
- Point of Control: The single longest bar, marking the price with the most traded volume, often treated as the fair-value magnet for that window.
- High Volume Nodes: Clusters of long bars where price lingered and heavy volume built, frequently behaving as durable support or resistance later.
- Low Volume Nodes: Thin sections where little traded, signalling zones price can slice through fast because few resting orders stand in the way.
- Value Area: The band holding roughly 70% of total volume, bounded by the Value Area High and Value Area Low that frame accepted price.
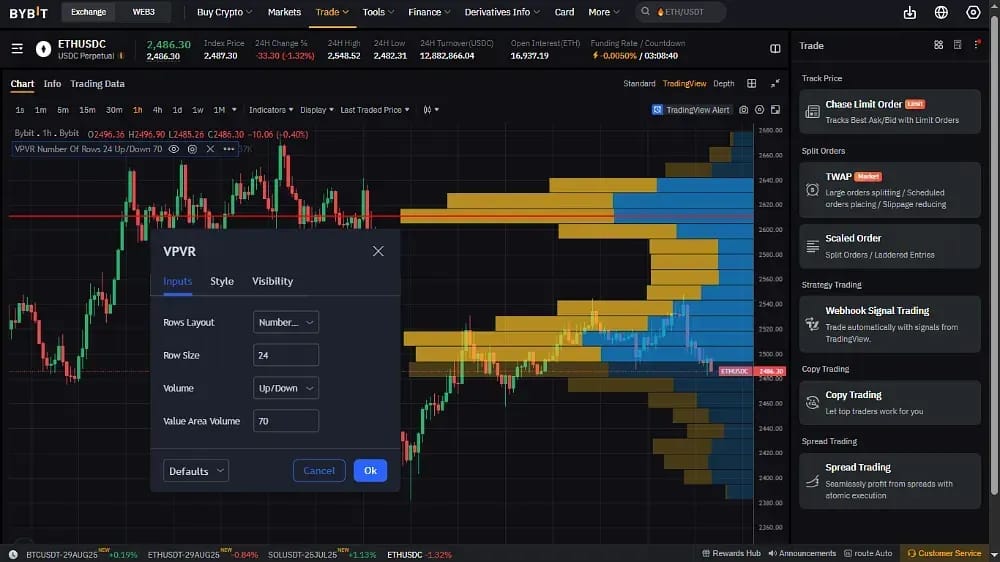
- Row size control: An adjustable input that sets histogram granularity, letting you sharpen or smooth detail depending on the timeframe you analyze.
Best Platforms to Set Up the VPVR Indicator
VPVR ships on most serious charting platforms, though access and depth vary. Below are the three most common routes, updated for how each one gates the tool in 2026, so you can pick the setup that matches your budget and workflow.
1. TradingView (Paid, Free Trial Available)
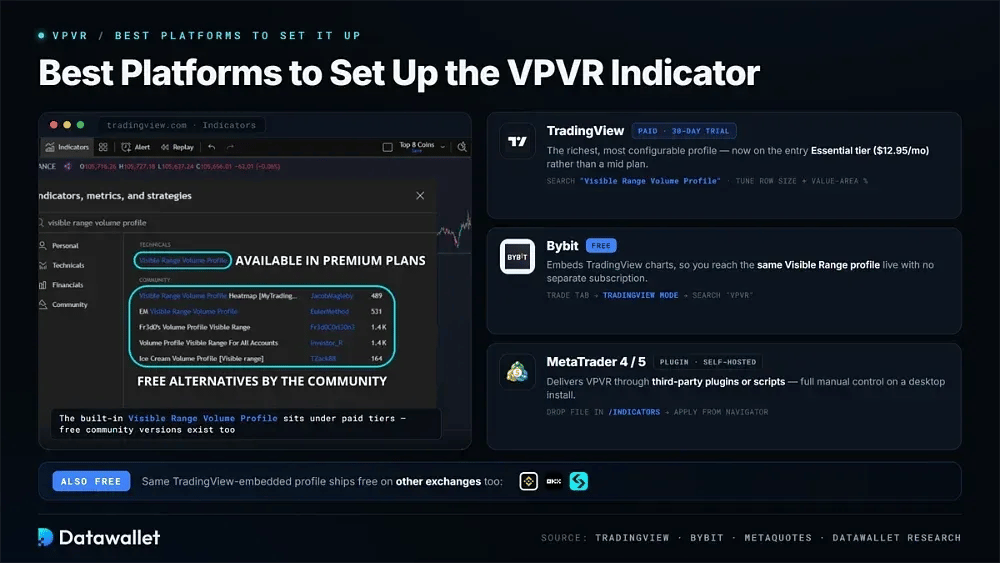
TradingView offers the richest, most configurable volume profile, and the key change since earlier guides is that it now sits on the entry-level Essential tier rather than a mid tier. A 30-day free trial lets you test it before paying.
Follow these steps to switch it on:
- Choose a plan or trial: Volume Profile indicators unlock from Essential ($12.95/mo annually), with Plus and Premium adding charts, alerts, and history rather than profile depth.
- Load your market: Open any asset and timeframe, whether that is BTC, ETH, SOL, an equity, or a futures contract, to anchor the chart.
- Open the indicators library: Click the "Indicators" button in the top toolbar to bring up the searchable list of built-in studies.
- Search "Visible Range Volume Profile": Type the name and select the version labelled Visible Range so the profile tracks whatever you have on screen.
- Tune the inputs: Adjust row size, value-area percentage, and up/down coloring to match your instrument and how much detail you want.
2. Bybit (Free)
Bybit embeds TradingView charts directly, which means you reach the same Visible Range Volume Profile at no cost and without a separate subscription. That makes it a practical option for crypto traders who want the tool free on live markets.
Here is how to add it:
- Open the trading chart: Head to Bybit's "Trade" tab, pick any spot or futures pair, and confirm the chart is set to TradingView mode rather than the native view.
- Search the indicator: Use the upper toolbar to open indicator search, type "Volume Profile" or "VPVR," and select the Visible Range result.
- Adjust the display: Double-click the profile to open settings and tweak resolution, scaling, or coloring so the histogram reads cleanly against price.
Note: The same free-via-TradingView access applies on other exchanges that embed those charts, including Binance, OKX, and Bitget.
3. MetaTrader (MT4/MT5)
MetaTrader 4 and 5 deliver VPVR through third-party plugins or custom scripts, and you will first need to install the desktop platform. This route suits traders who prefer a self-hosted setup with full manual control over their indicators.
- Install MT4 or MT5: Download the version your broker supports and complete the standard installation on your machine.
- Load an instrument: Launch the platform, choose a symbol, and open its candlestick chart to prepare for the indicator.
- Find a profile plugin: Search the Market or Code Base directories for a VPVR-compatible tool, usually listed under "Volume Profile."
- Install the file: Save the plugin, then drop it into the "Indicators" folder inside your MetaTrader installation directory.
- Apply from Navigator: Restart the platform, locate the tool under "Custom Indicators," and drag it onto your chart to activate it.
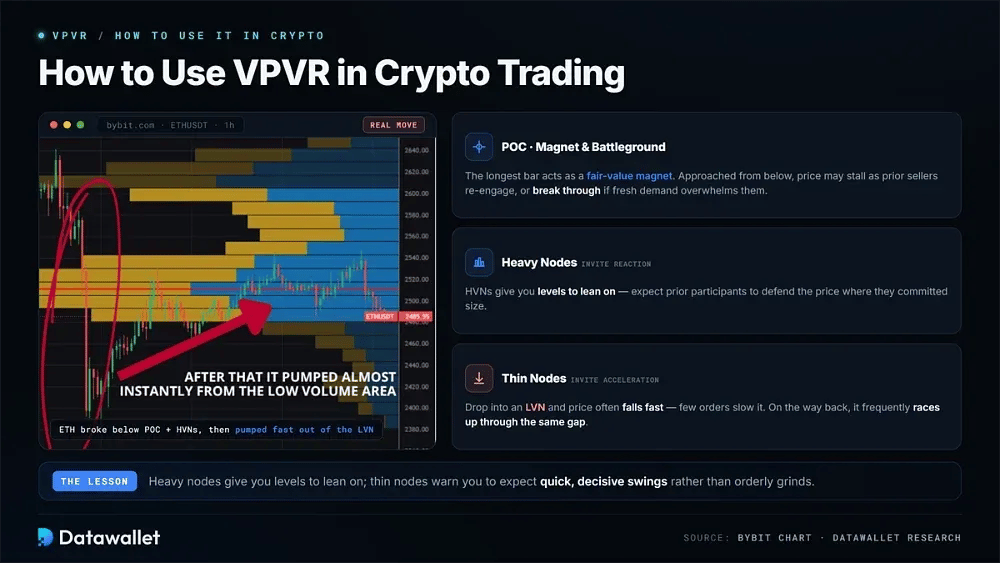
How to Use VPVR in Crypto Trading
To ground the theory, picture a BTC/USDT chart on a daily timeframe with VPVR applied across a multi-week window. The profile immediately separates the levels the market cares about from the ones it drifted through, which is exactly the edge you want before committing risk.
Suppose the Point of Control forms as the longest bar near a heavily traded price, well above where spot currently sits. That level tends to behave as a magnet and a battleground at once. Approaching it from below, price may stall as prior sellers re-engage, or break through if fresh demand overwhelms them.
Beneath the current price, a stretch of shrinking bars marks a low volume node. If a macro catalyst or a liquidation cascade drives price into that pocket, it often falls fast because few orders sit there to slow it. When price later reclaims the gap, it frequently races back up through the same thin zone.
That asymmetry is the practical lesson: heavy nodes invite reaction and give you levels to lean on, while thin nodes invite acceleration and warn you to expect quick, decisive swings rather than orderly grinds.
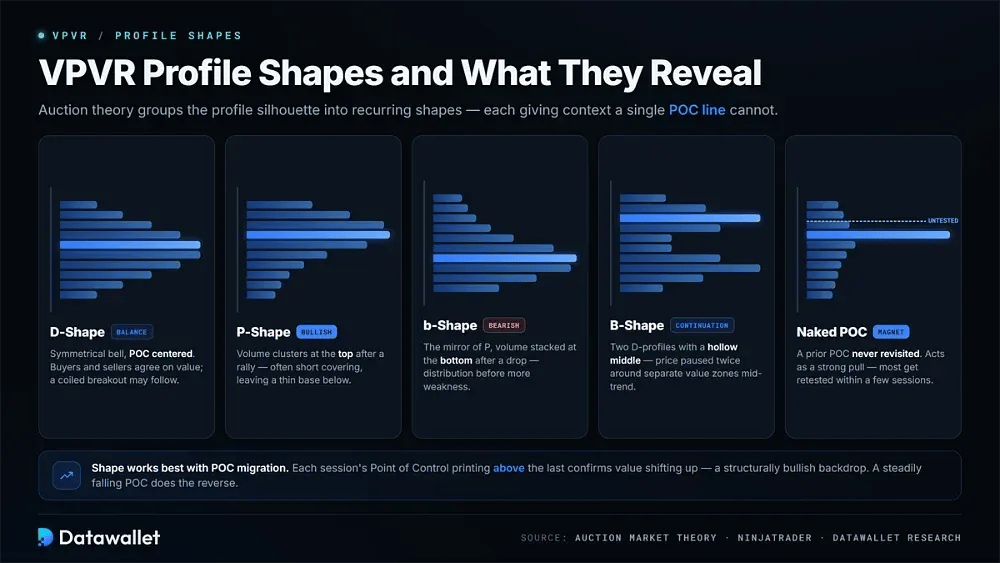
VPVR Profile Shapes and What They Reveal
Beyond individual nodes, the overall silhouette of the profile carries information. Auction theory groups these into four recurring shapes, and learning to spot them at a glance gives context that a single POC line cannot, telling you whether the market is balanced, exhausting, or trending.
The shapes traders watch for break down as follows:
- D-shape: A symmetrical bell with the POC centered signals balance, a market where buyers and sellers agree on value, and where NinjaTrader notes a coiled breakout may follow.
- P-shape: Volume clusters at the top after a sharp rally, generally read as bullish, often reflecting short covering that leaves a thin, unsupported base below the peak.
- b-shape: The mirror of the P, with volume stacked at the bottom after a hard drop, usually read as bearish and pointing to distribution before further weakness.
- B-shape: Two D-profiles stacked with a hollow middle, typically a trend-continuation signal where price paused twice around separate value zones.
- Naked POC: A prior Point of Control price never revisited since, which acts as a strong pull, with historical studies suggesting most get retested within a handful of sessions.
Shape works best alongside POC migration. When each session's Point of Control prints above the last, value is shifting upward and confirms a structurally bullish backdrop; a steadily falling POC does the reverse. Reading trend through where value is accepted, rather than price alone, is what separates a volume-aware trader from someone drawing lines.
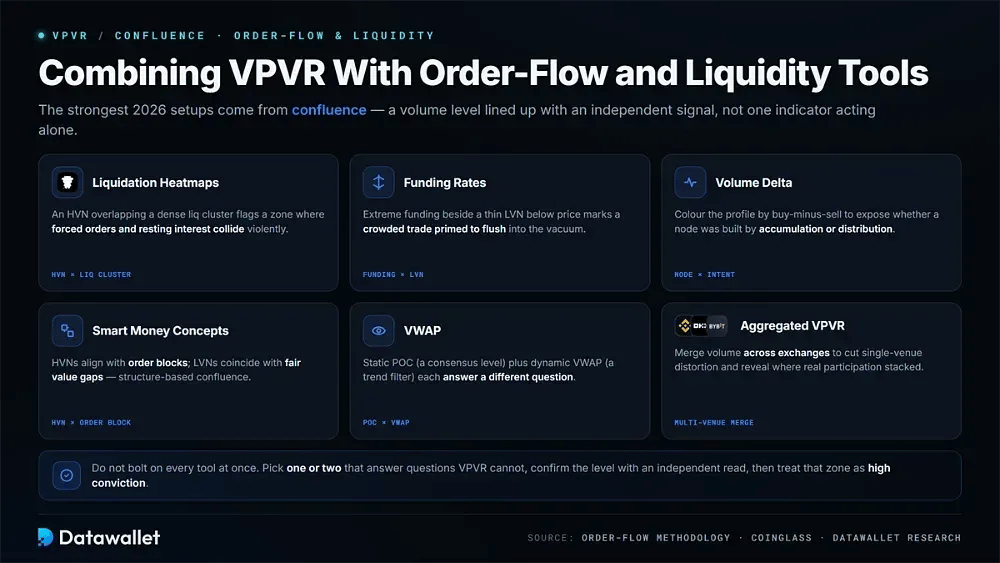
Combining VPVR With Order-Flow and Liquidity Tools
VPVR is powerful on its own, but its levels sharpen dramatically when stacked against other data. In 2026, the strongest setups come from confluence, where a volume level lines up with an independent signal from order flow, liquidity, or positioning, rather than from any single indicator acting alone.
The pairings crypto traders lean on most include these combinations:
- Liquidation heatmaps: A high volume node that overlaps a dense cluster on the Bitcoin liquidation heatmap flags a zone where forced orders and resting interest could collide violently.
- Funding rates: Extreme funding alongside a thin LVN below price often marks a crowded trade primed to flush fast into the vacuum when leverage unwinds.
- Volume delta: Coloring the profile by buy-minus-sell pressure exposes whether a heavy node was built by accumulation or distribution, adding intent to raw size.
- Smart Money Concepts: HVNs frequently align with institutional order blocks while LVNs coincide with fair value gaps, turning volume zones into confluence for structure-based entries.
- VWAP: Pairing the static POC with the moving volume-weighted average price separates a consensus level from a dynamic trend filter, each answering a different question.
- Aggregated VPVR: Community scripts that merge volume across exchanges like Binance, OKX, and Bybit reduce single-venue distortion and reveal where real participation stacked.
The point is not to bolt on every tool at once. Pick one or two that answer questions VPVR cannot, confirm a level with an independent read, and only then treat that zone as high conviction. Layered signals filter out the low-quality noise that trips up single-indicator traders.
What Are Common Mistakes When Using VPVR?
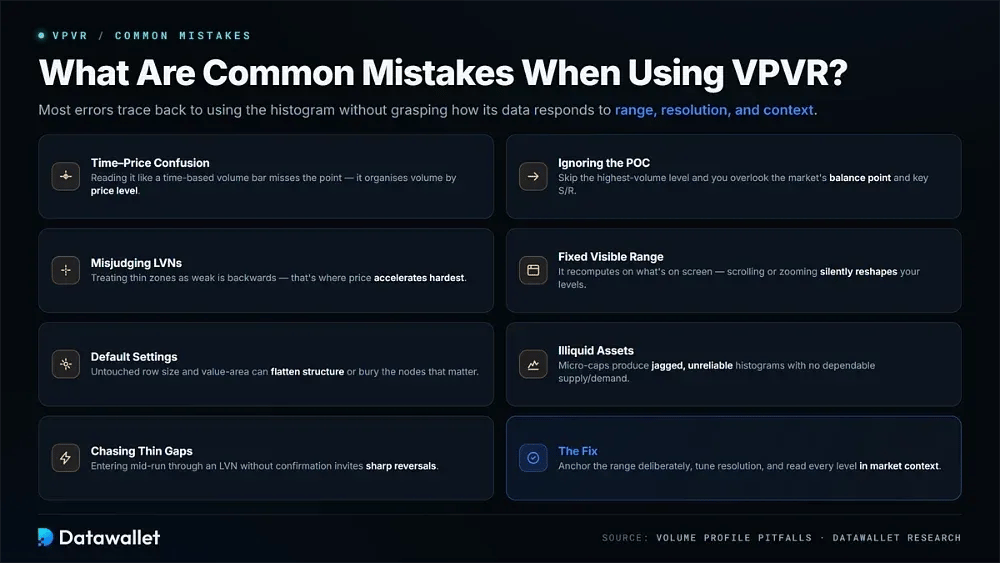
Most VPVR errors trace back to using the histogram without grasping how its data responds to range, resolution, and market context. These slips quietly distort the signal and push traders into decisions built on shaky ground.
Watch for these recurring pitfalls when the profile is live:
- Time-price confusion: Reading VPVR like a standard time-based volume bar misses the whole point, since it organizes volume by price level instead of by candle.
- Ignoring the POC: Skipping the highest-volume level often means overlooking the market's balance point, and with it a key support or resistance reference.
- Misjudging LVNs: Treating thin zones as weak is backwards, as they are frequently where price accelerates hardest through a near-empty book.
- Fixed visible range: Forgetting that VPVR recomputes on what is on screen means scrolling or zooming can silently reshape the levels you were trading.
- Default settings: Leaving row size and value-area thresholds untouched can flatten meaningful structure or bury the nodes that actually matter.
- Illiquid assets: Applying it to micro-caps produces jagged, unreliable histograms that fail to reflect any dependable supply and demand.
- Chasing thin gaps: Entering mid-run through an LVN without confirmation invites the sudden reversals those vacuum zones are known for.
Differences Between VPVR and Other Volume Indicators
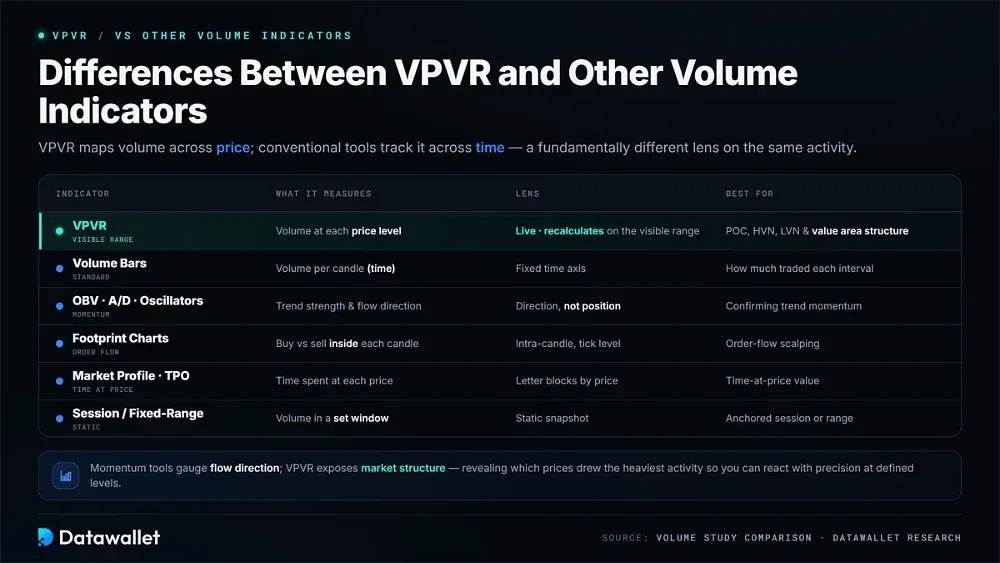
VPVR stands apart because it maps volume across price, whereas conventional tools track it across time. Basic volume bars tell you how much traded during each candle; VPVR tells you where along the price axis that trading actually landed, which is a fundamentally different lens on the same activity.
Momentum-focused tools sit in another category entirely. On-Balance Volume, Accumulation/Distribution, and volume oscillators gauge trend strength or flow direction, not spatial position. VPVR instead exposes market structure by revealing which prices drew the heaviest activity, letting traders react with more precision at defined levels.
It also differs from its own siblings. Footprint charts split buy versus sell volume inside each candle for order-flow scalping, while market profile (TPO) tracks time at price using letter blocks. Session and fixed-range profiles give static snapshots, whereas VPVR refreshes with every shift of the visible window.
Final Thoughts
VPVR gives real analytical edge, but it is a map of where volume has already pooled, not a crystal ball for where hype wants price to go. Use it to anchor trades in genuine participation instead of headlines, especially when the crowd is chasing meme coins with no structure behind the move.
In thin, low-liquidity corners, volume gaps are not just risky, they are where bagholders tend to form. When the histogram looks hollow, there is usually a reason the disciplined money stayed away, and a reason you should treat that emptiness as a warning rather than an invitation.