October 10 (10/10) Explained: The Crypto Crash
Summary: The October 10, 2025 crypto crash (also called 10/10) was a record liquidation cascade that wiped over $19 billion in leveraged positions across the world.
During the crash, bids vanished near the mid, network congestion slowed transfers, and Binance-visible USDe deviations intensified collateral stress before markets stabilized.
What Was the October 10 (10/10) Crypto Crash?
The October 10 (10/10) crypto crash was a fast, mechanical unwind of record leverage that turned a risk-off Friday into a derivatives firestorm. Within 24 hours, forced liquidations topped $19 billion, erasing positions across majors and alts simultaneously.
Market mechanics were pushed beyond sustainable failure points as over 1.6 million trading accounts were decimated within a single 24-hour window. This event surpassed previous record crashes, including the FTX collapse, representing a total failure of risk management systems.
Beyond immediate price declines, the crash exposed fundamental vulnerabilities in exchange infrastructure and oracle pricing models. The resulting liquidity vacuum led to extreme price wicks where major tokens traded near zero, permanently altering the industry's perception of market stability.
Why Did the Crypto Market Crash on October 10?
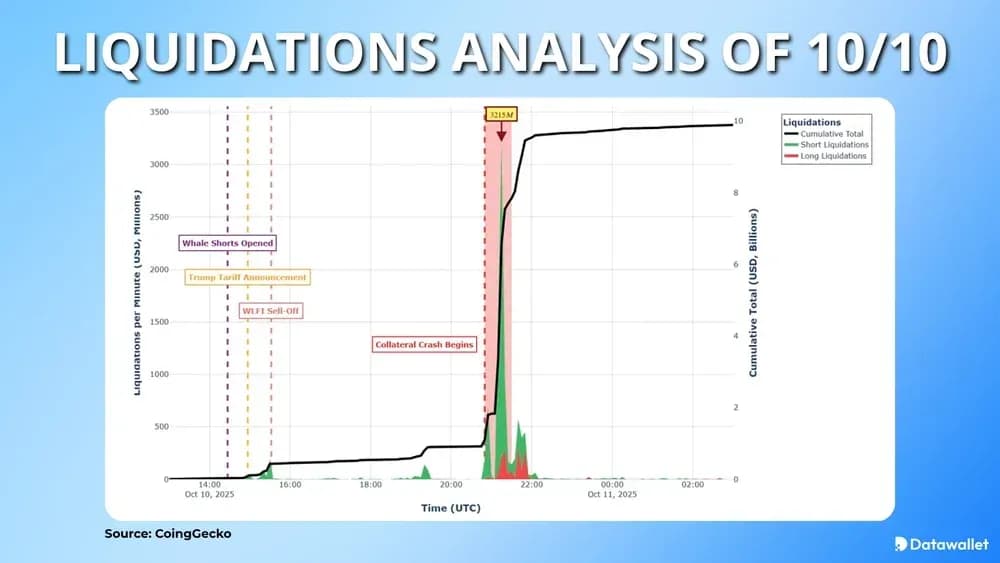
The catalyst for the 10/10 crypto crash was macro: Donald Trump announced sweeping 100% tariffs on Chinese imports, jolting global risk assets and pushing crypto into profit-taking. With open interest near records and weekend liquidity thinner, small moves quickly turned into forced selling.
As volatility spiked, market makers’ risk limits pulled bids, leaving little depth near the mid on several venues. Ethereum congestion then slowed deposits and arbitrage, widening cross-venue gaps. Cross-margin portfolios amplified contagion as losses in one leg drained collateral everywhere.
Chronology of Events
The October 10 crash went down in a tight sequence, where macro headlines, thinning liquidity, and exchange-specific stress points stacked on top of each other within minutes.
Below is the minute-by-minute chain of key shocks:
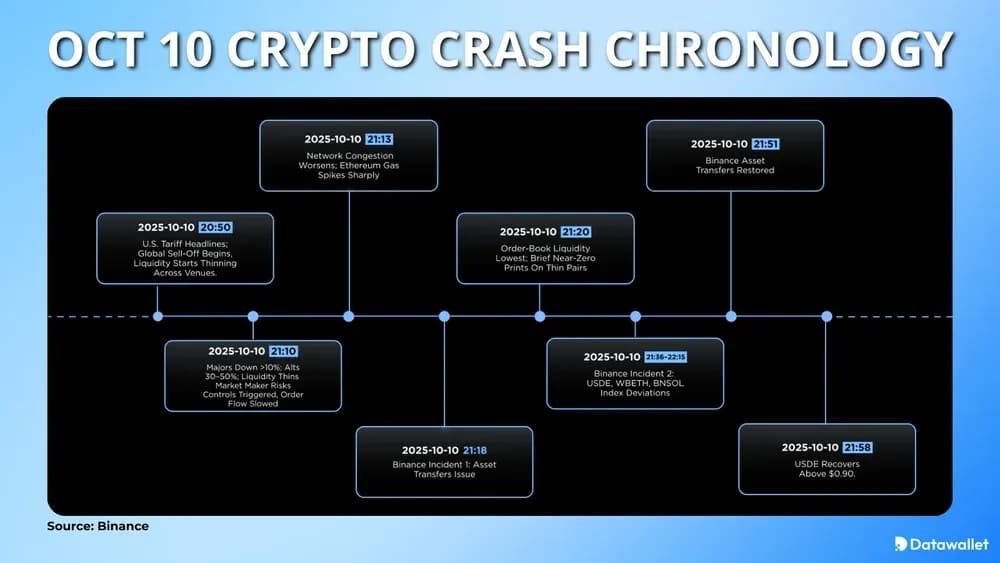
- (20:50 UTC): Tariff headlines hit; global sell-off begins, and crypto liquidity starts thinning across venues immediately ahead of weekend trading.
- (21:10 UTC): Majors drop over 10% and alts crater 30-50%; market-maker risk controls trigger, spreads widen, and order flow slows.
- (21:13 UTC): Network congestion worsens; Ethereum gas spikes sharply, delaying confirmations and making cross-exchange rebalancing and collateral transfers materially harder.
- (21:15 UTC): Liquidation reflexivity peaks; about $3.21B is force-closed in 60 seconds as thin books turn market sells into violent wicks.
- (21:18 UTC): Binance incident 1 begins: internal asset transfers slow, briefly blocking some Spot-Earn-Futures moves while matching and liquidations continue.
- (21:20 UTC): Order-book liquidity hits session lows; brief near-zero prints appear on thin pairs as bids vanish close to the mid.
- (21:36-22:15 UTC): Binance incident 2: indices for USDe, WBETH, and BNSOL deviate as local liquidity thins and cross-venue arbitrage lags.
- (21:51-21:58 UTC): Transfers are restored, and USDe rebounds above $0.90 shortly after, finally reducing collateral stress as spreads begin normalizing.
Binance’s Role in the 10 October 2025 Crypto Crash
Because the sharpest USDe depeg and wrapped-token index deviations were most visible on Binance, the exchange became a focal point for blame for October 10. Critics argue its incentives and collateral settings amplified leverage loops, while Binance says timing and data disprove causation.
Allegations
OKX CEO Star Xu argued 10/10 wasn’t “complex” at all: a high-yield (12% APY) USDe campaign encouraged traders to swap USDT/USDC into USDe, then reuse it as collateral. In his view, that loop manufactured hidden leverage that snapped under macro stress.
The allegation hinges on the Binance-only dislocation: USDe traded down near $0.65 on Binance while staying close to $1 elsewhere, critics say. Once collateral value fell, cross-margin accounts liquidated across perps, spilling losses into majors and alts.
Binance's Response
Binance’s post-mortem blog post says the sell-off began with tariff-driven risk aversion meeting crowded leverage, then worsened as market makers pulled liquidity and spreads widened. It also states roughly 75% of that day’s liquidations occurred before USDe’s reported index deviations.
Binance acknowledged two platform-specific incidents, including slowed internal transfers (21:18-21:51 UTC) and temporary index deviations in USDe/WBETH/BNSOL. The exchange said that matching and risk checks stayed live, and it later credited affected users with over $328 million in total.
How Big Was the October 10 Crypto Crash?
By datasets, 10/10 became the largest liquidation day on record: more than $19 billion in forced closures and roughly 1.6 million liquidated accounts. The intensity was unprecedented, with around $6.9 billion cleared in just 40 minutes during the peak wave.
Spot prices moved like a flash-crash: Bitcoin fell about 14.5% to roughly $104,783, Ether slid near 12% to around $3,436, and Solana briefly lost more than 40%. Total crypto market cap dropped about $350 billion before stabilizing into October 11.
Biggest Liquidations During the October 10 Crash
The following data points illustrate the most severe financial losses and price drawdowns recorded during the 10/10 liquidation event.
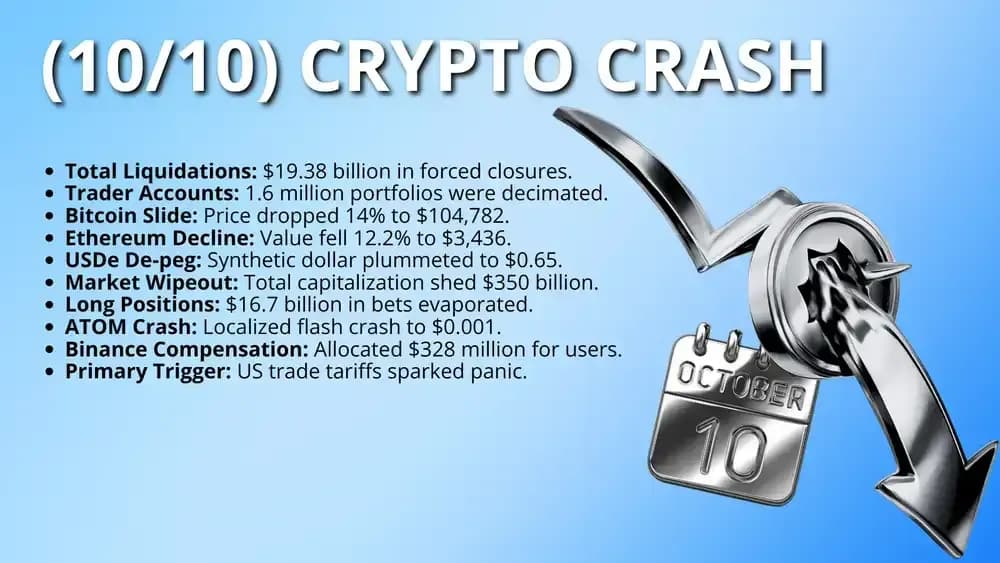
- Bitcoin (BTC): Price plummeted 14% to a local low of $104,782.
- Ethereum (ETH): Asset value dropped 12.2% to a price of $3,436.
- Solana (SOL): Wiped out 40% of its value in mere minutes.
- Total Liquidations: Record-breaking $19.38 billion in forced position closures.
- Long Liquidations: $16.7 billion in long bets evaporated within hours.
- Cosmos (ATOM): Experienced a localized flash crash to $0.001.
- USDe De-peg: Stablecoin value fell to $0.65 due to internal pricing.
Which Exchanges Were The Most Affected?
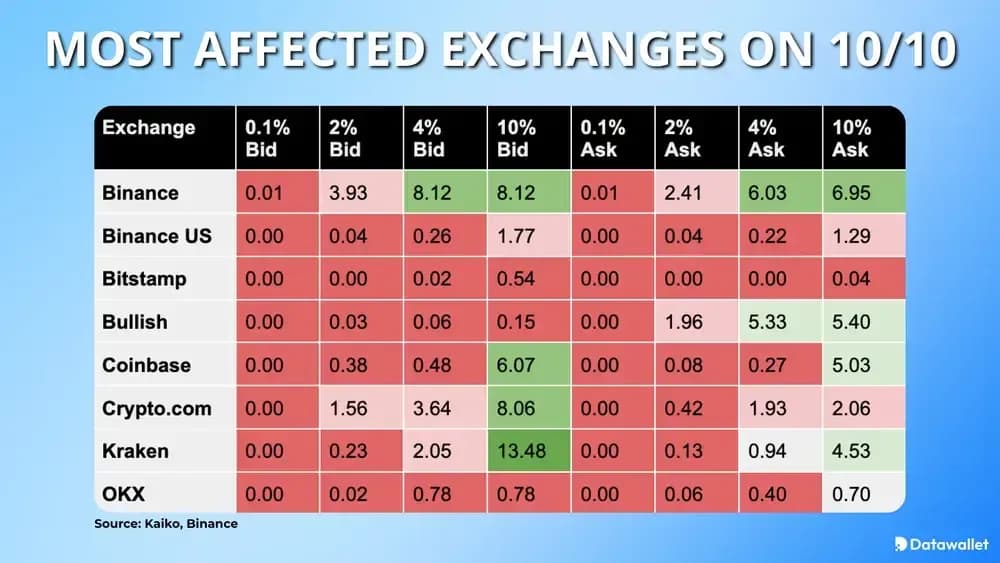
Data from Kaiko reveals that Bitcoin liquidity virtually vanished across major exchanges during the peak sell-off window on October 10. We can compare the bid-ask spreads and liquidity depths below:
- Binance: Near-mid depth was tiny (0.01 at 0.1%), yet wider bands still showed 8.12 bid at 4-10% off mid-price.
- Crypto.com: Order books were thin at the touch, but depth appeared at distance - 3.64 bid at 4% and 8.06 at 10%.
- Kraken: Kraken retained the largest far-band support in the snapshot, with 13.48 bid at 10% despite 0.00 at 0.1%.
- Coinbase: Coinbase showed some resilience only at wider bands, reaching 6.07 bid at 10% while 0.00 at 0.1% level.
- OKX: OKX looked hollow near the mid, with just 0.02 bid at 2% and 0.78 at 4-10% in Kaiko data.
- Binance.US: Binance US had scarce depth even far from mid, only 1.77 bid at 10% and 0.04 at 2%.
- Bitstamp: Bitstamp appeared nearly empty during the snapshot, with 0.00 at 2% and only 0.54 bid at 10% band.
- Bullish: Bullish had minimal bid support (0.15 at 10%), but comparatively heavy asks, showing 5.33 at 4% and 5.40 at 10%.
Takeaways From the October 10 Crash for Crypto Traders
The 10/10 crash provides critical lessons for managing risk in a market dominated by mechanical leverage and high-frequency algorithmic trading systems.
1. Leverage and Margin Discipline
Size leverage for worst-case gaps, not average volatility. Use isolated margin where possible, keep excess collateral off cross-margin pools, and reduce exposure ahead of weekends. When funding and open interest surge together, treat it as a flashing “crowded trade” warning.
Avoid leverage loops that depend on a stablecoin staying stable. If yield looks promotional, assume it can disappear during stress and model the collateral haircut yourself. Diversify collateral into higher-quality assets and keep a cash buffer for emergency margin adds.
2. Liquidity First, Price Second
In crashes, the “price” is whatever the last forced fill prints. Track order-book depth and spreads, and assume slippage rises when market makers pull quotes. Place limit orders where possible and avoid chasing wicks driven by thin books.
Operational friction matters: when Ethereum gas spikes and confirmations slow, moving collateral or arbitraging becomes harder when you need it. Keep collateral pre-positioned on the venue you trade, maintain accounts on multiple exchanges, and rehearse withdrawal and transfer paths beforehand.
3. Exchange and Index Mechanics
10/10 highlighted venue design risk: oracle inputs and liquidation engines (like Auto-Deleveraging) can behave differently under stress. Read how your exchange prices collateral, what happens during index deviations, and whether circuit breakers pause liquidations. Treat “core systems up” as separate from usability.
Plan for platform strain even without an outage. Keep API keys, backups, and alerting so you notice margin problems early, and document every action during volatility. If an exchange offers compensation programs, understand eligibility rules before you assume you’re covered.
Final Thoughts
Unlike the FTX collapse, 10/10 was mostly mechanical (leverage meeting vanished liquidity), showing how quickly crypto’s plumbing can fail at scale without insolvency headlines.
The event also echoed the May 2010 equity flash crash: localized dislocations, delayed arbitrage, and a lingering trust deficit that outlasted the bounce.
Whether regulators force leverage caps and oracle standards, or exchanges self-reform, the next rally will be judged by how 10/10’s weak points were fixed.
Frequently asked questions

.webp)