


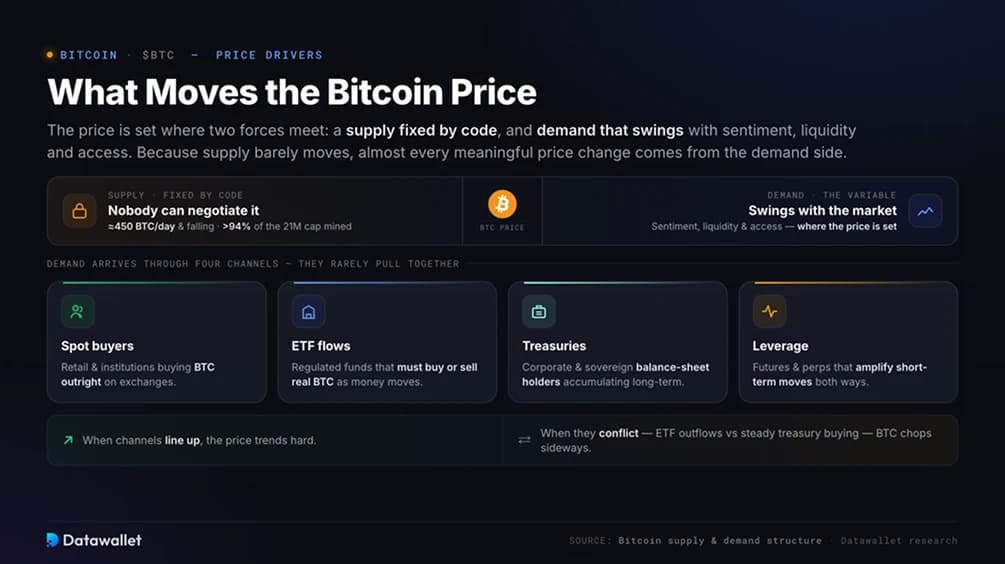
What Moves the Bitcoin Price
The Bitcoin price is set where two forces meet: a supply that is fixed by code, and demand that swings with sentiment, liquidity and access. Supply is the part nobody can negotiate. New issuance is roughly 450 BTC a day and falling, and more than 94% of the 21 million cap has already been mined. Because that side of the equation barely moves, almost every meaningful price change comes from the demand side.
Demand arrives through a handful of distinct channels, and they rarely pull in the same direction at once:
- Spot buyers: retail and institutions buying BTC outright on exchanges.
- ETF flows: regulated funds that must buy or sell real Bitcoin as money moves in and out.
- Corporate and sovereign treasuries: balance-sheet holders accumulating for the long term.
- Leverage and derivatives: futures and perpetuals that amplify short-term moves in both directions.
When several of these line up, the price trends hard. When they conflict, say ETF outflows against steady treasury accumulation, Bitcoin chops sideways while the market works out which buyer wins. Reading the price well means knowing which channel is driving the tape on any given day.
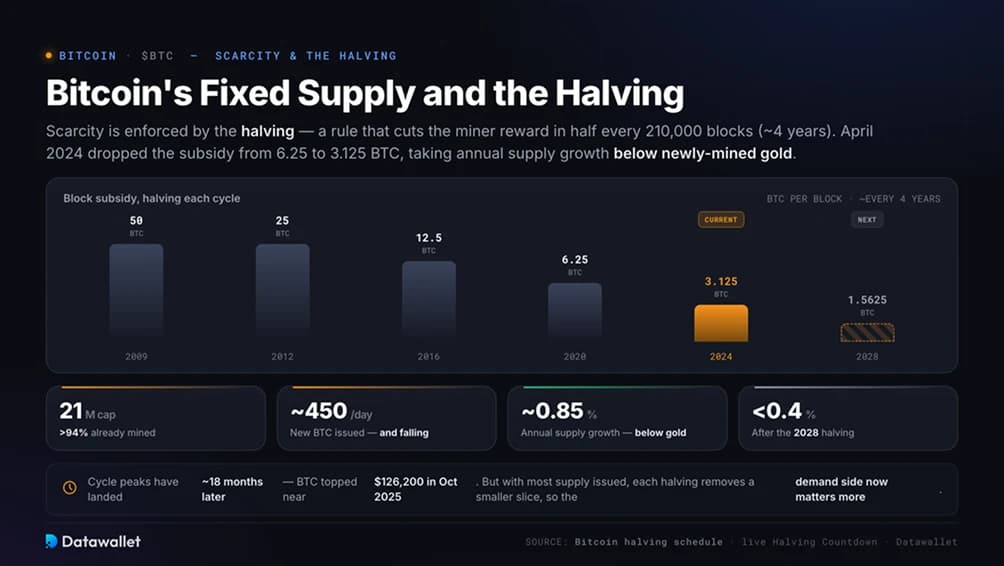
Bitcoin's Fixed Supply and the Halving
Bitcoin's scarcity is enforced by the halving, a protocol rule that cuts the reward paid to miners in half every 210,000 blocks, or roughly every four years. The April 2024 halving dropped the block subsidy from 6.25 to 3.125 BTC, taking annual supply growth to about 0.85%, below the rate at which new gold is mined. The next halving, expected in 2028, will push that figure under 0.4%.
Historically, each supply cut has preceded a major price expansion, with cycle peaks landing roughly 18 months later. That pattern held again in this cycle: Bitcoin topped near $126,200 in October 2025, about 18 months after the 2024 halving. What is changing is the force of the mechanism. With most of the supply already issued, each halving removes a smaller slice of daily sell pressure, so the supply shock matters less on its own and the demand side matters more.
You can track the exact blocks, issuance and date on our live Bitcoin Halving Countdown.
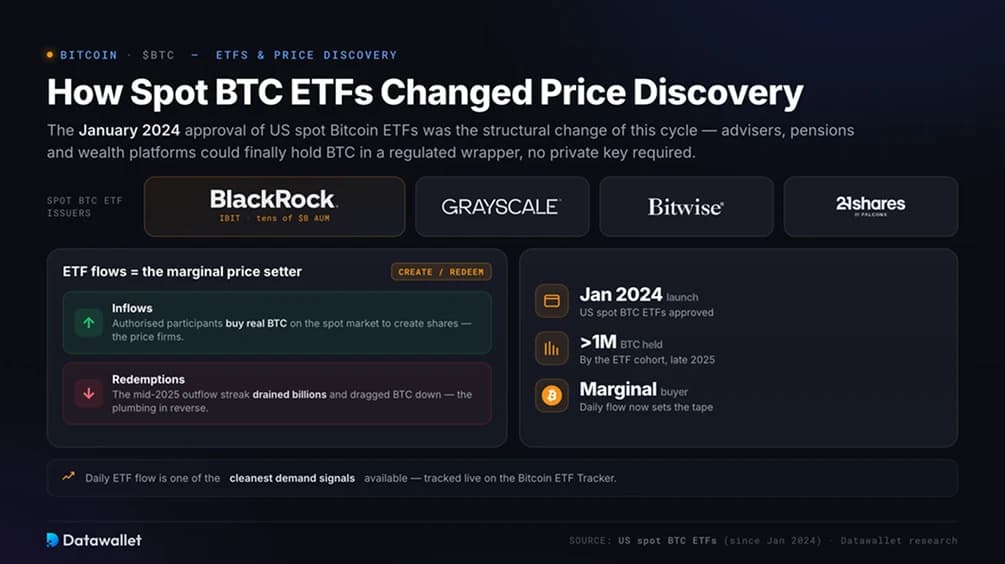
How Spot BTC ETFs Changed Price Discovery
The approval of US spot Bitcoin ETFs in January 2024 was the structural change of this cycle. For the first time, advisers, pension funds and wealth platforms could hold Bitcoin through a regulated wrapper without touching a private key. The funds bought hard, and by late 2025 the cohort held well over a million BTC, with BlackRock's IBIT alone running into the tens of billions in assets.
That made ETF flows the marginal price setter. When inflows are strong, authorised participants buy real Bitcoin on the spot market to create shares, and the price firms. When redemptions stack up, as they did during the multi-week outflow streak in mid-2025 that drained billions and dragged BTC down with it, that same plumbing works in reverse.
For anyone trading or allocating today, daily ETF flow is one of the cleanest demand signals available, which is why we track it live on the Bitcoin ETF Tracker.
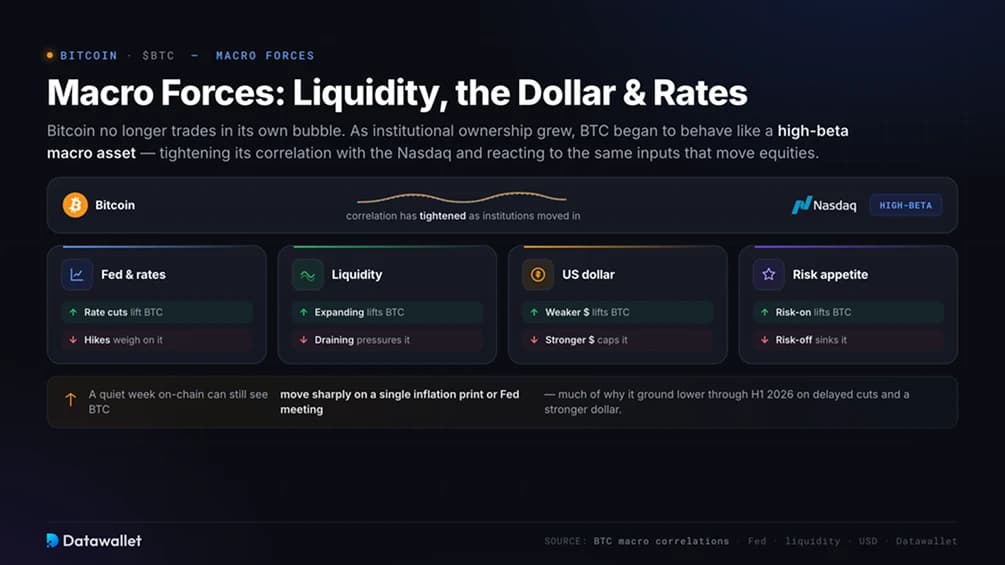
Macro Forces: Bitcoin, Liquidity, the Dollar and Rates
Bitcoin no longer trades in its own bubble. As institutional ownership has grown, BTC has started to behave like a high-beta macro asset, tightening its correlation with the Nasdaq and reacting to the same inputs that move equities: Federal Reserve policy, global liquidity, the strength of the US dollar and the market's appetite for risk.
The relationship is intuitive once you see it. Looser financial conditions, such as rate cuts, a weaker dollar or expanding central-bank balance sheets, tend to lift Bitcoin alongside other risk assets. Tighter conditions, sticky inflation or a stronger dollar do the opposite, which is much of why BTC spent the first half of 2026 grinding lower against a backdrop of delayed rate cuts and renewed dollar strength.
The takeaway for price watchers: a quiet week on-chain can still see Bitcoin move sharply on a single inflation print or Fed meeting.
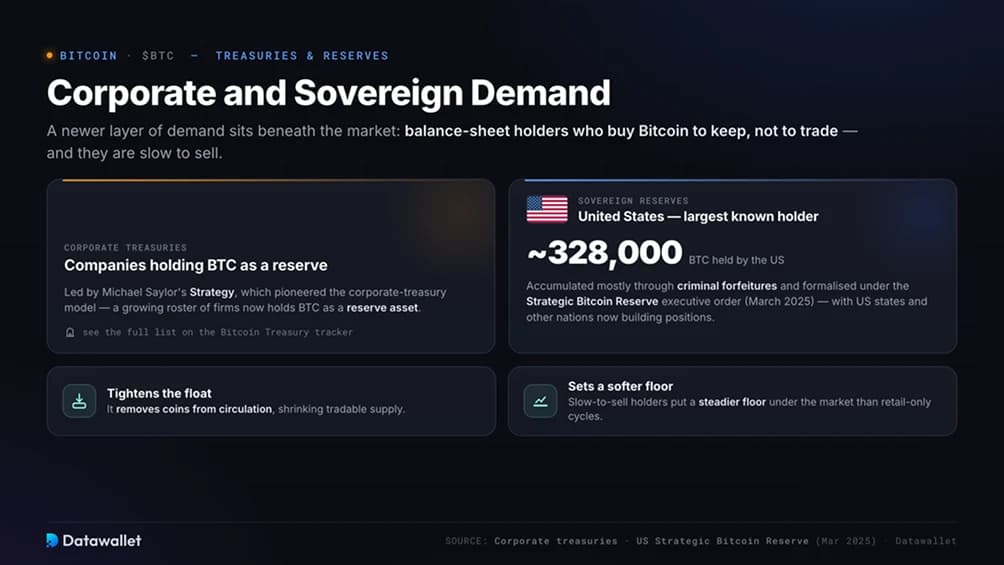
Corporate and Sovereign Demand
A newer layer of demand sits beneath the market: balance-sheet holders who buy Bitcoin to keep, not to trade. Public companies led by Michael Saylor's Strategy pioneered the corporate treasury model, and a growing roster of firms now holds BTC as a reserve asset. You can see the full list and aggregate holdings on our Bitcoin Treasury tracker.
Governments have joined them. The United States is the largest known state holder, with roughly 328,000 BTC accumulated mostly through criminal forfeitures and formalised under the Strategic Bitcoin Reserve executive order signed in March 2025, with several US states and a handful of other nations building their own positions.
This cohort matters for price in two ways - it removes coins from circulation and tightens float, and because these holders are slow to sell, it sets a softer floor under the market than retail-only cycles ever had.
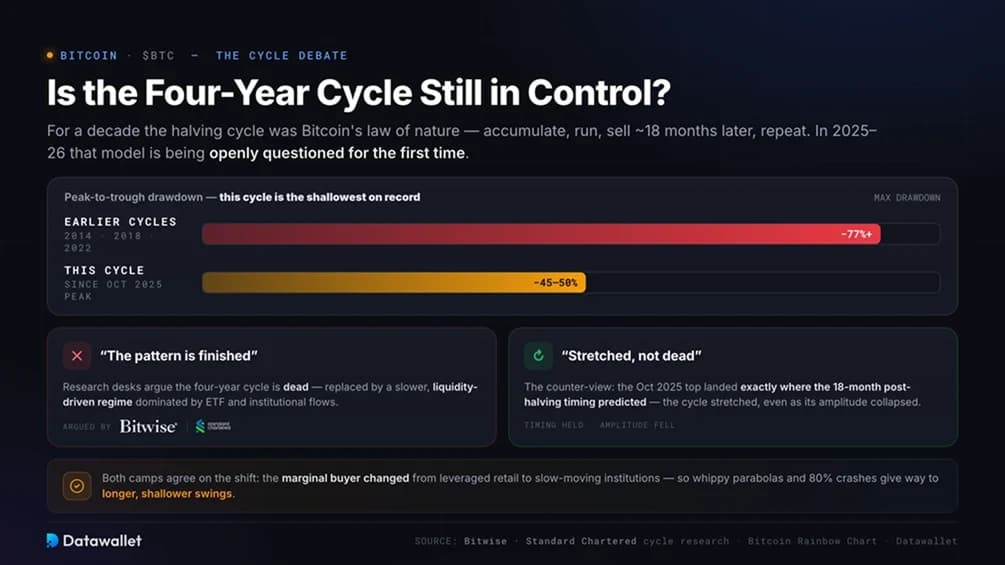
Is the Four-Year Cycle Still in Control?
For a decade, the four-year halving cycle was the closest thing Bitcoin had to a law of nature: accumulate after the halving, ride the bull run, sell roughly 18 months later, repeat. In 2025 and 2026 that model is being openly questioned for the first time. Bitcoin's drawdown from the October 2025 peak has been the shallowest on record, closer to 45% to 50% versus the 77%-plus crashes that ended earlier cycles, and research desks at firms like Bitwise and Standard Chartered have argued the pattern is finished, replaced by a slower, liquidity-driven regime dominated by ETF and institutional flows.
The counter-argument is that the cycle has stretched rather than died: the October 2025 top landed exactly where the 18-month post-halving timing predicted, even as the amplitude collapsed. Both camps agree on the underlying shift, which is that the marginal buyer has changed from leveraged retail to slow-moving institutions, softening both the highs and the lows. For price, that means whippy parabolas and 80% bear markets may give way to longer, shallower swings.
Long-horizon valuation tools like the Bitcoin Rainbow Chart help frame where the current price sits within that wider arc.
Reading the Bitcoin Price With On-Chain Data
The live price is a single number, but the forces behind it are visible if you know where to look. A few data sets do most of the work:
- Fear & Greed Index: a fast read on whether sentiment is stretched in either direction.
- Bitcoin Dominance: whether capital is concentrating in BTC or rotating out toward altcoins.
- Bitcoin Open Interest and funding rates: how much leverage is in the system and which side is paying to hold it.
- BTC Liquidation Heatmap: the price zones where leveraged positions get force-closed, which often act as magnets for volatility.
None of these is a standalone buy or sell signal. They work as corroboration: when the price moves, they tell you whether real demand, leverage or sentiment is behind it, and that context is usually worth more than the move itself.
A Short History of the Bitcoin Price
Bitcoin began with no market price at all. In 2010, developer Laszlo Hanyecz paid 10,000 BTC for two pizzas, coins that today would be worth hundreds of millions of dollars. The first run to $1,000 came in 2013, followed by the 2017 surge near $20,000 and the 2021 cycle peak above $68,000, each driven by a fresh wave of adoption and each followed by a steep correction.
The current era looks different. Spot ETFs pulled demand forward, and Bitcoin set a new all-time high before the 2024 halving for the first time ever, then climbed to a record near $126,200 in October 2025 on the back of institutional inflows and a weakening dollar. The drawdown since has been unusually contained, a sign, many argue, that the asset has matured from retail-driven speculation into a macro allocation.
Where the price goes next is contested, but the through-line of Bitcoin's history is consistent: each cycle has been larger, less volatile and more institutional than the one before.
