


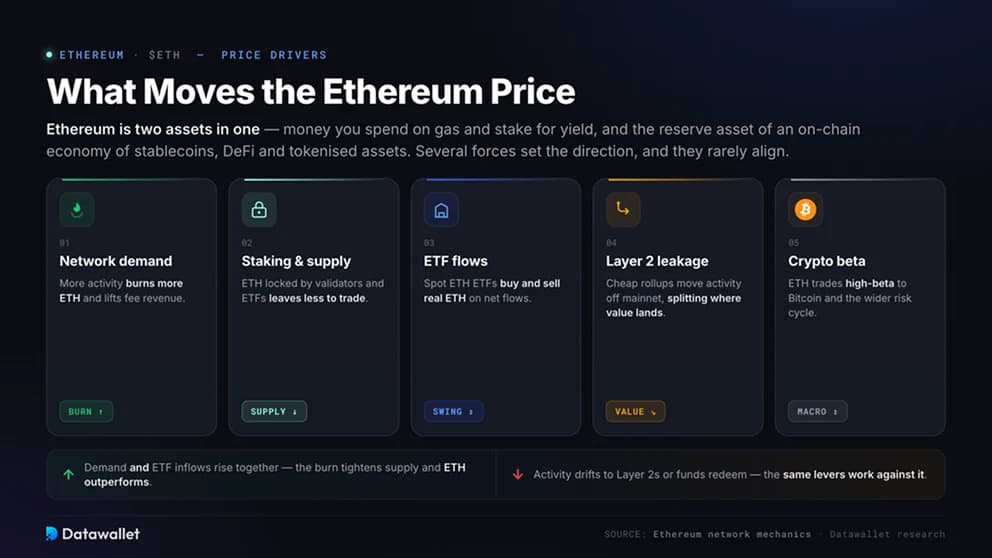
What Moves the Ethereum Price
Ethereum is two assets in one. ETH is money you spend on gas and stake for yield, and the reserve asset of an on-chain economy of stablecoins, DeFi and tokenised assets. Its price reflects demand for both at once.
Several forces set the direction, and they rarely align:
- Network demand: more activity burns more ETH and lifts fee revenue;
- Staking and supply: ETH locked by validators and ETFs leaves less to trade;
- ETF flows: spot Ethereum ETFs buy and sell real ETH on net flows;
- Layer 2 leakage: cheap rollups move activity off mainnet, splitting where value lands;
- Crypto beta: ETH trades high-beta to Bitcoin and the wider risk cycle.
When demand and ETF inflows rise together, the burn tightens supply and ETH outperforms. When activity drifts to Layer 2s or funds redeem, those same levers work against it.
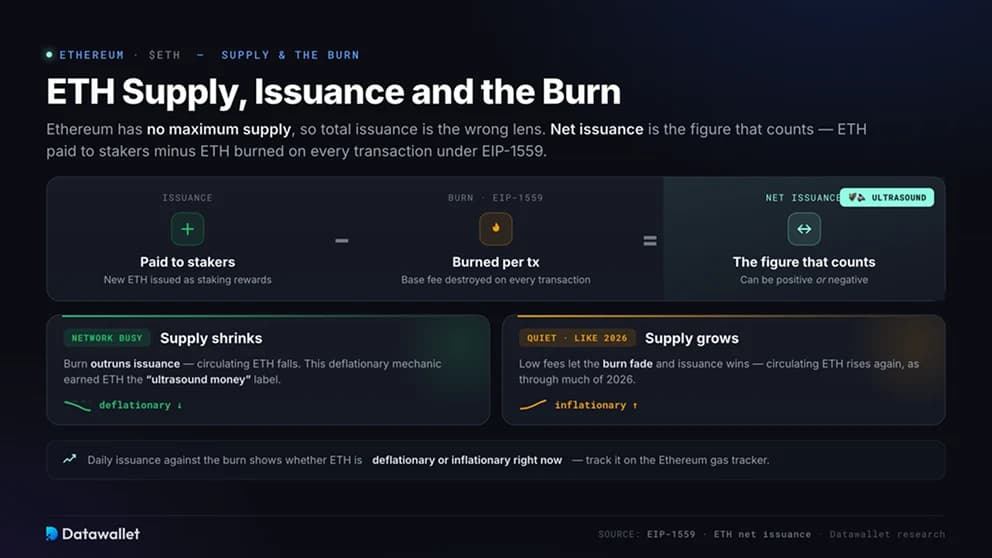
ETH Supply, Issuance and the Burn
Ethereum has no maximum supply, so total issuance is the wrong lens. Net issuance is the figure that counts, the ETH paid to stakers minus the ETH burned on every transaction under EIP-1559. When the network is busy, the burn can outrun issuance and circulating supply shrinks.
That mechanism earned ETH the ultrasound money label. In quiet markets, like much of 2026, low fees let the burn fade and supply grows again. Daily issuance against the burn on our Ethereum gas tracker shows whether ETH is deflationary or inflationary right now.
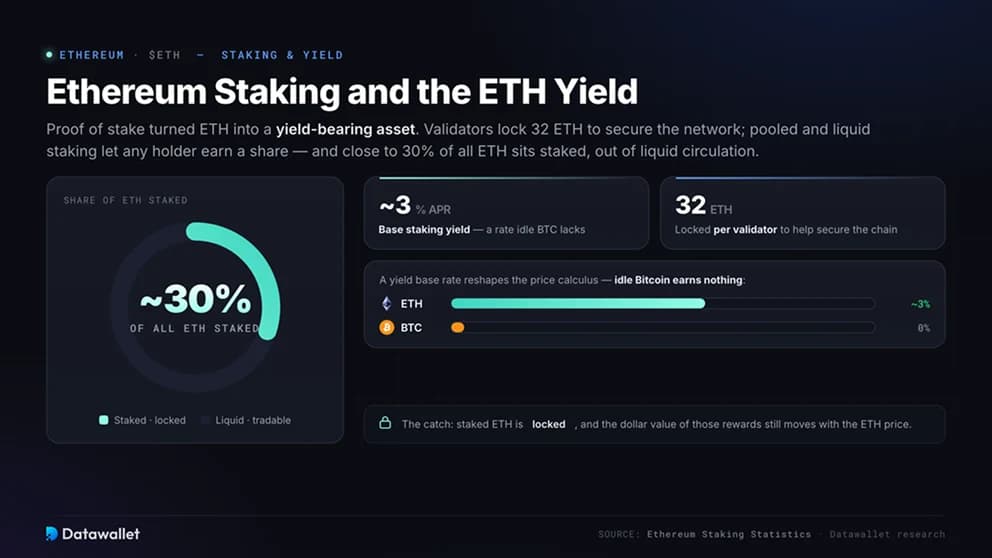
Ethereum Staking and the ETH Yield
Proof of stake turned ETH into a yield-bearing asset. Validators lock 32 ETH to help secure the network and earn rewards, while pooled and liquid staking let any holder earn a share. Close to 30% of all ETH is staked, out of liquid circulation.
Yield reshapes the price calculus. A return near 3% gives ETH a base rate that idle Bitcoin lacks, and it has pulled tens of billions into validators and staking products. The catch is that staked ETH is locked, and the dollar value of those rewards still moves with the ETH price.
For more information about staking, check out our Ethereum Staking Statistics report.
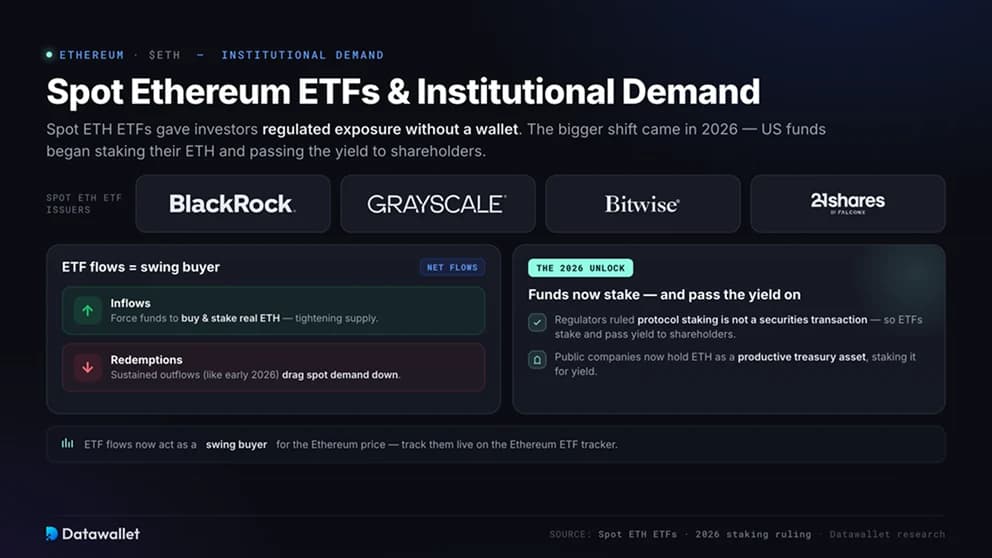
Spot Ethereum ETFs and Institutional Demand
Spot Ethereum ETFs gave investors regulated ETH exposure without a wallet. The bigger shift came in 2026, when US funds began staking their ETH and passing the yield to shareholders, after regulators ruled that protocol staking is not a securities transaction. Public companies now hold ETH as a productive treasury asset too, staking it for yield.
ETF flows now act as a swing buyer for the Ethereum price. Inflows force funds to buy and stake real ETH, tightening supply, while sustained redemptions, like the early-2026 outflows, drag spot demand down. Track them live on our Ethereum ETF tracker.
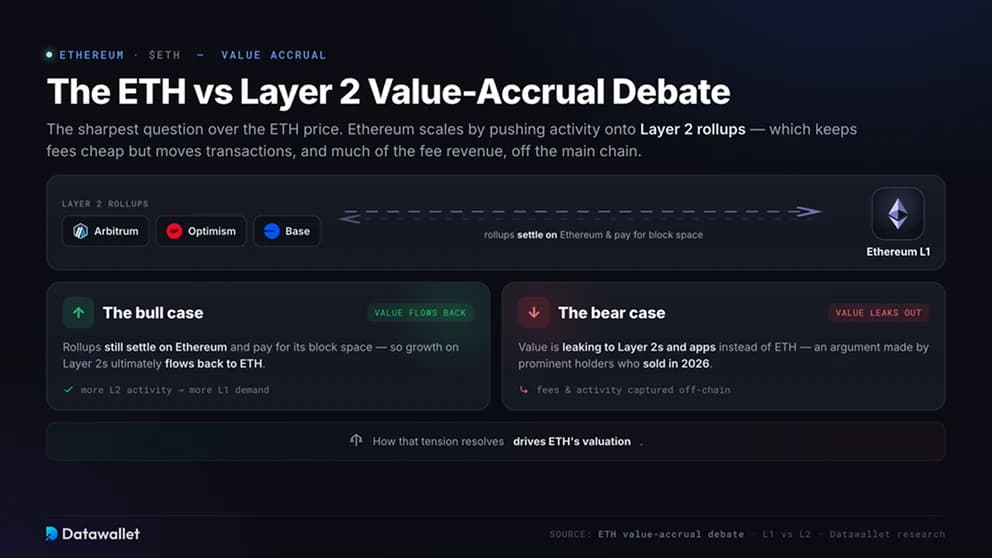
The ETH vs Layer 2 Value-Accrual Debate
Value accrual is the sharpest question over the Ethereum price. Ethereum scales by pushing activity onto Layer 2 rollups, which keeps fees cheap but moves transactions, and much of the fee revenue, off the main chain.
Bulls argue rollups still settle on Ethereum and pay for its block space, so growth flows back to ETH. Bears, including prominent holders who sold in 2026, argue value is leaking to Layer 2s and apps instead. How that resolves drives ETH's valuation.
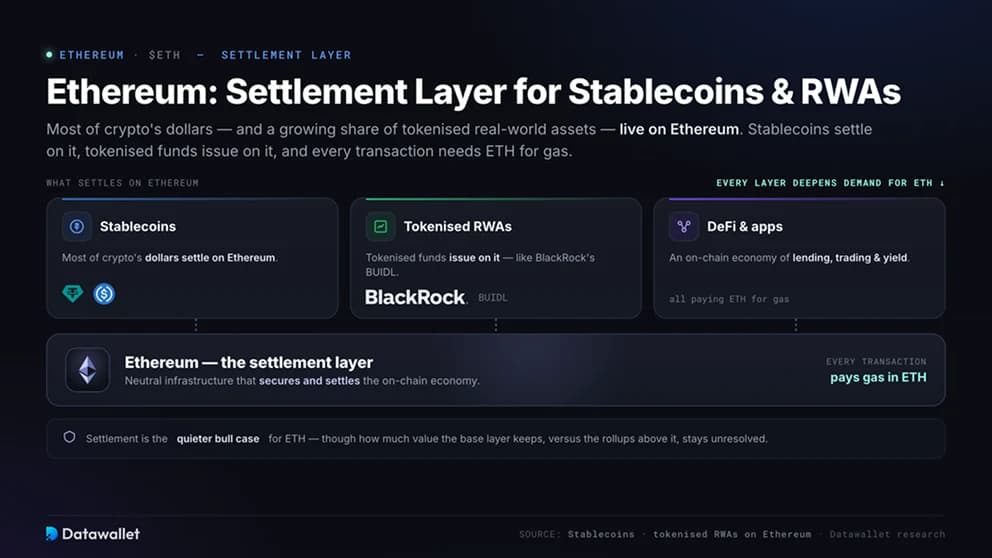
Ethereum as the Settlement Layer for Stablecoins and RWAs
Most of crypto's dollars and a growing share of tokenised real-world assets live on Ethereum. Stablecoins settle on it, tokenised funds like BlackRock's BUIDL issue on it, and every transaction needs ETH for gas.
Settlement is the quieter bull case for ETH. As more finance moves on-chain, Ethereum's role as neutral infrastructure deepens demand for the ETH that secures and pays for it. How much of that value the base layer keeps, versus the rollups above it, stays unresolved.
Risks That Shape the Ethereum Price
ETH carries risks that go beyond ordinary crypto volatility:
- Value leakage: cheap Layer 2s can capture the activity and fees that once accrued to ETH;
- Competition: faster chains like Solana compete for developers, users and liquidity;
- No supply cap: net issuance can turn positive in quiet markets, diluting holders;
- Insider and ETF selling: large holders and fund redemptions can pressure price, as in early 2026;
- Regulation: rules on staking, ETFs and stablecoins still shape institutional access.
None of these sinks the long-term thesis alone, but together they explain why ETH lagged Bitcoin this cycle and why its valuation stays contested.
A Short History of the Ethereum Price
ETH sold for around $0.31 in its 2014 crowdsale and launched in 2015. It ran to roughly $1,400 in early 2018, collapsed, then hit about $4,800 in 2021 on the DeFi and NFT booms. After The Merge in 2022 it recovered and reached a record near $4,950 in August 2025.
Early 2026 reversed it hard, with ETH sliding toward $1,700 on recession fears, ETF outflows and insider selling. Across every cycle, ETH has tracked demand for Ethereum block space and the strength of its on-chain economy, amplified by high beta to Bitcoin. Watch where leverage sits on our live ETH liquidation heatmap.
