





.png)
.png)



What Does the Bitcoin Liquidation Heatmap Show?
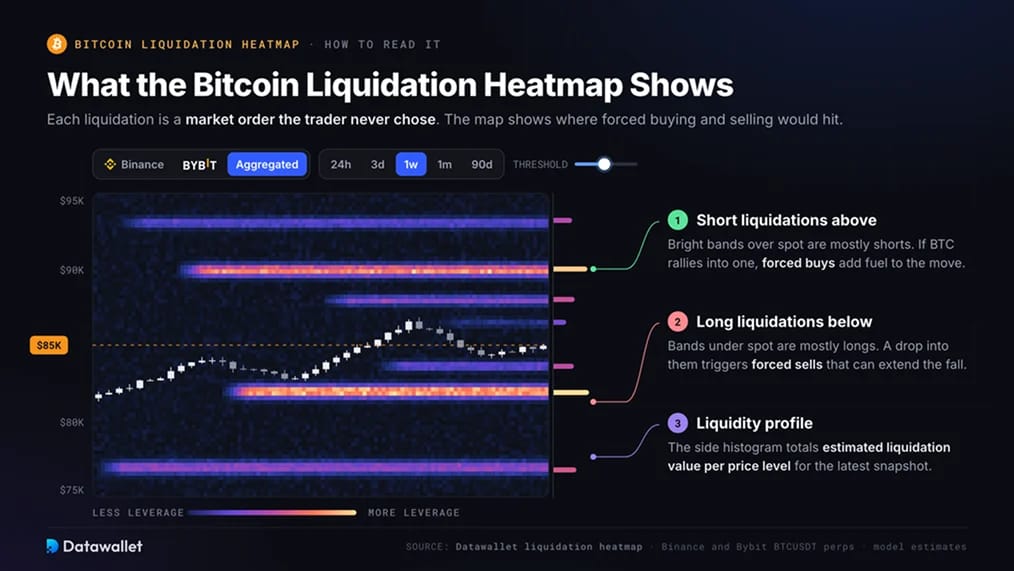
The Bitcoin liquidation heatmap estimates the price levels where leveraged BTC perpetual futures positions would be force-closed. Every liquidation is a market order the trader never chose to place. The map therefore shows where forced buying and forced selling would hit relative to the current Bitcoin price.
Datawallet builds the chart from BTCUSDT perpetual futures data on Binance and Bybit. You can view each exchange on its own or use the Aggregated view, and set the window anywhere from 24 hours to 90 days.
- Bright bands: These are price levels where a large amount of estimated leverage would liquidate. Bands above price are mostly short liquidations, which become forced buys. Bands below price are mostly long liquidations, which become forced sells.
- Threshold slider: Hides weaker levels so only the heaviest clusters stay on the chart. This helps when the 90-day view gets crowded.
- Liquidity profile: The side histogram adds up estimated liquidation value at each price level for the latest snapshot. It makes the nearest long and short pools easy to compare.
- Key levels panel: Lists the largest clusters above and below spot, next to rolling 24-hour totals for long and short liquidations.
How Are BTC Liquidation Prices Calculated?
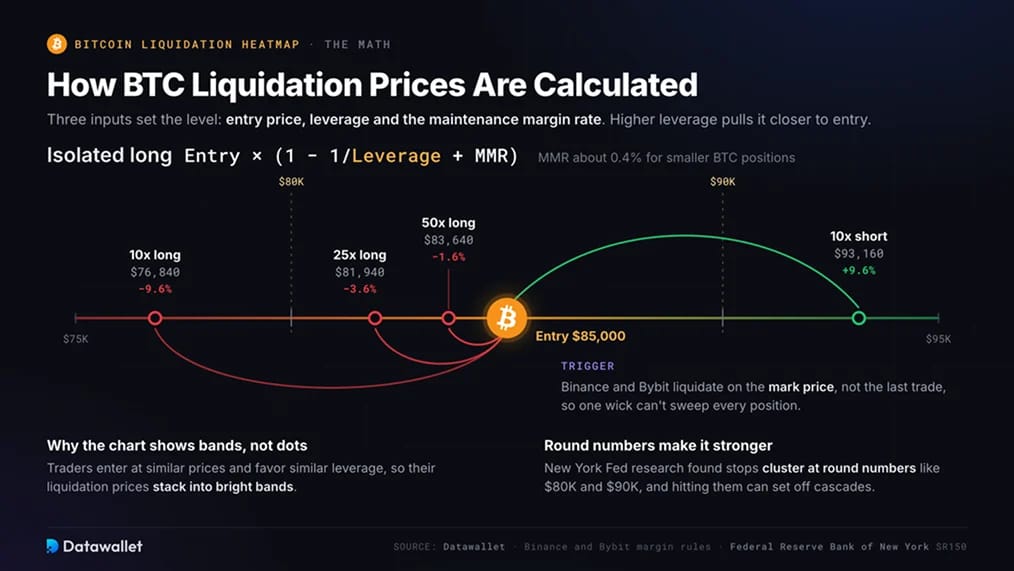
Three inputs set a liquidation price: the entry price, the leverage, and the exchange's maintenance margin rate. When the margin left in a position falls below maintenance margin, the exchange's risk engine takes the position over and closes it.
Binance and Bybit both trigger liquidation on the mark price rather than the last traded price. The mark price is a fair-value reference built from a spot index, so a single wick on a thin order book can't wipe out every nearby position.
For an isolated long, the approximate liquidation price is entry × (1 − 1/leverage + maintenance margin rate). With a maintenance rate of about 0.4%, which is typical for smaller BTC positions, a long opened at $85,000 liquidates near:
- 10x long: about $76,840, roughly 9.6% below entry
- 25x long: about $81,940, roughly 3.6% below entry
- 50x long: about $83,640, roughly 1.6% below entry
A 10x short from the same entry liquidates near $93,160. Traders tend to enter at similar prices and use similar leverage, so their liquidation prices stack into the bands you see on the chart.
Round numbers make the stacking stronger. Research from the Federal Reserve Bank of New York found that stop-loss orders cluster around round numbers and can set off self-reinforcing price cascades when price reaches them. The same thing happens when BTC trades into a dense liquidation band.
Exchanges don't publish individual liquidation prices, so every heatmap is a model. It combines open interest, the prices where that open interest was added, and an assumed spread of leverage. The result shows where liquidation risk is concentrated. It is not a record of actual positions.
What Is Driving Bitcoin Leverage?
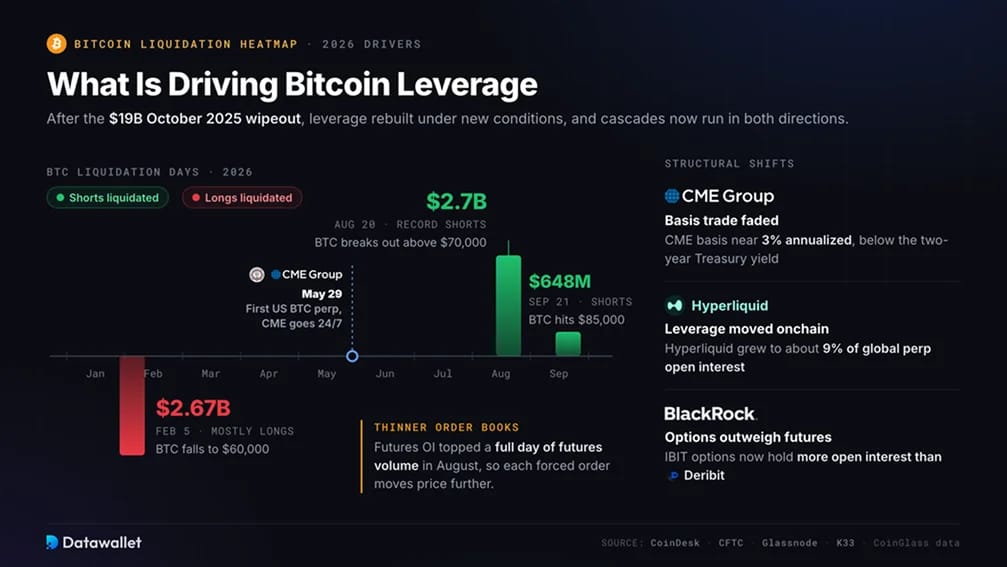
Bitcoin's derivatives market changed shape after the October 10, 2025 crash. Roughly $19 billion of positions were liquidated in 24 hours, and perpetual futures open interest fell 43%. Leverage has rebuilt since then, but under different conditions.
- Cascades now run both ways: In February 2026, $2.67 billion was liquidated in a single day, most of it longs, as BTC fell to $60,000. By August the pressure had reversed. On August 20, shorts lost a record $2.7 billion as BTC broke out of a six-week range above $70,000. Another $648 million of shorts were liquidated on September 21 as BTC reached $85,000.
- Thin liquidity makes every liquidation bigger: Glassnode data from August 2026 showed BTC futures open interest larger than a full day of futures volume, while spot volume was the lowest since 2019. On thin order books, each forced order moves price further and pushes more positions into liquidation.
- Leverage moved offshore and onchain: The CME basis trade that used to anchor institutional positioning shrank to about 3% annualized, below the two-year Treasury yield. CME open interest fell below Binance's for the first time since 2023. Hyperliquid, a decentralized perpetuals exchange, grew to about 9% of global perpetual open interest.
- Perpetual futures came onshore in the US: On May 29, 2026, the CFTC approved its first bitcoin perpetual futures contract on a US-regulated exchange. The same day, CME started trading crypto futures and options 24/7. Weekend moves that used to happen only on offshore venues now happen on regulated markets too.
- Options open interest now exceeds futures: BTC options open interest has been larger than futures open interest since mid-2025. Options on BlackRock's IBIT ETF now hold more open interest than Deribit. Large strikes pull on price as well. The $60,000 put carried more than $1 billion of open interest during the June 2026 selloff.
How to Use the BTC Heatmap With Other Data
A liquidation cluster tells you where forced orders sit. Other data tells you whether price is likely to reach them.
- Measure distance, not just brightness: A $1 billion cluster 2% from spot matters far more than the same cluster 15% away. Use the 24h and 3d views for near-term levels, and the 1m or 90d views for levels that have held through several rallies.
- Compare exchanges before trusting a level: A band that shows on Binance, on Bybit and in the Aggregated view reflects broad positioning. A band that shows on only one venue may be a single large trader.
- Check open interest: Open interest rising into a dense band means new leverage is still arriving at that level. Datawallet's Bitcoin open interest tracker shows whether positioning is building or unwinding across exchanges.
- Use funding to break ties: Positive funding with heavy long clusters below spot suggests crowded longs. Negative funding with heavy short clusters above spot suggests fuel for a short squeeze, which is how August 2026 played out.
- Watch for voids after a sweep: Once a cluster has been liquidated, that level usually goes dark on the heatmap. Price can move quickly through the empty space until it reaches the next pool of leverage.
What the Bitcoin Heatmap Can't Tell You
- Levels are estimates: Cross-margin and portfolio-margin accounts use their whole balance as collateral, so their real liquidation prices can sit far from where the model assumes.
- Reported liquidations undercount: Binance's public liquidation feed shows at most one liquidation per symbol each second. During fast crashes, true totals can be much higher than the public figures.
- It covers only part of the market: The map doesn't include CME futures, options hedging, spot ETF flows or onchain venues like Hyperliquid. A selloff driven by spot selling can move BTC through levels with few liquidations involved.
- It doesn't predict direction: The heatmap shows where forced orders would land, not which side breaks first. Macro shocks, ETF flows and tariff or central-bank headlines usually decide that.
- Exchange safeguards change outcomes: Partial liquidation engines shrink large positions in steps. When insurance funds run low, auto-deleveraging can close profitable positions on the other side of the trade.