
.png)
.png)



What Does the XRP Liquidation Heatmap Show?
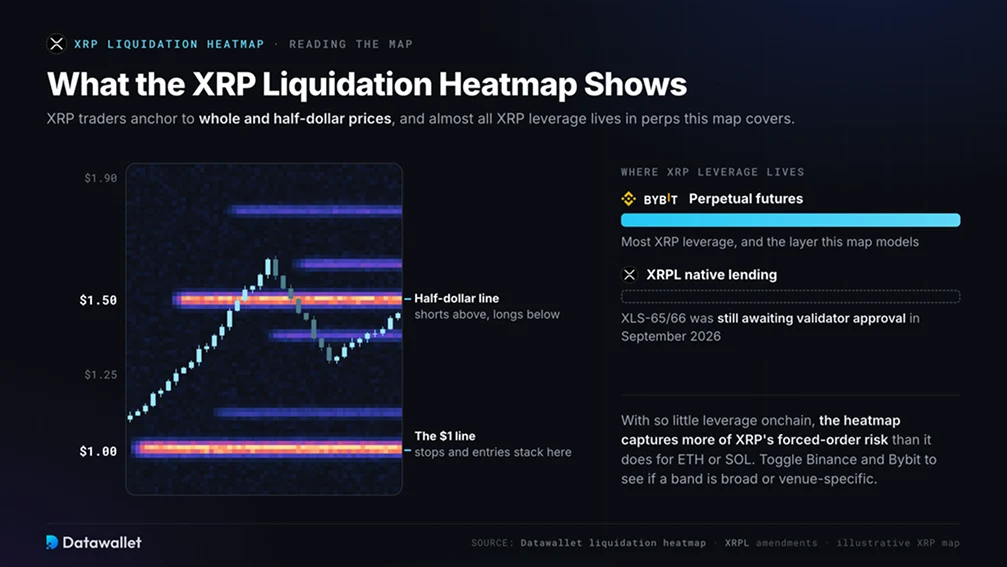
The XRP liquidation heatmap estimates the prices at which leveraged XRP/USDT perpetual futures positions on Binance and Bybit would be force-closed. Clusters above the XRP price are mostly short positions that would be forced to buy back. Clusters below are mostly long positions that would be forced to sell.
XRP traders anchor heavily to whole-dollar and half-dollar prices, so bright bands tend to stack around levels like $1.00 and $1.50. Toggle between Binance and Bybit to check whether a band reflects broad positioning or one venue's order flow. Then use the key levels panel to see which side of price holds the larger pool.
XRP has a feature that makes this map unusually representative: very little XRP leverage lives onchain. The XRP Ledger's native lending protocol (XLS-65/66) was still waiting for validator approval in September 2026. Most XRP leverage therefore sits in perpetual futures, and not in DeFi loans the heatmap can't see.
Why Is XRP Leverage Moving to Regulated Venues?
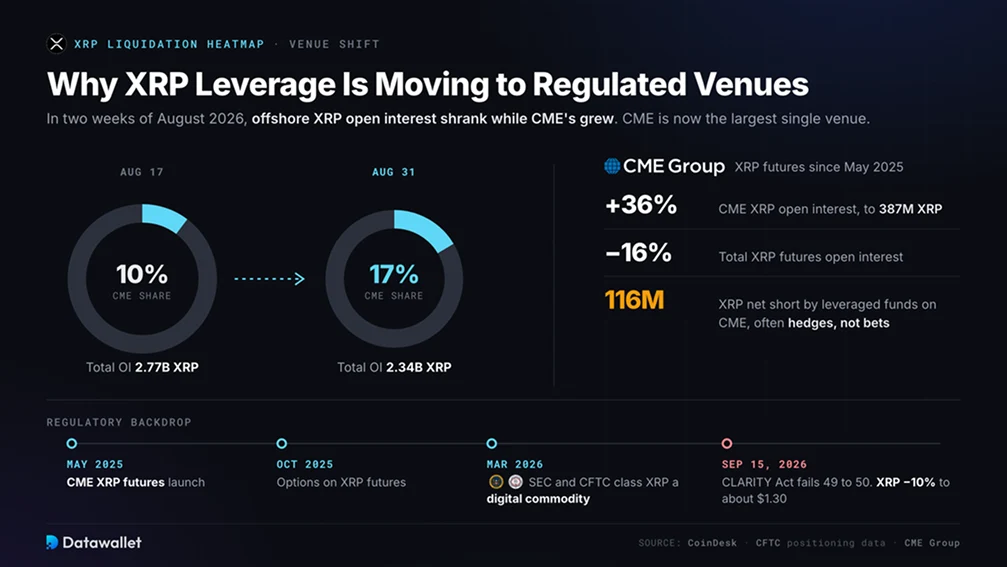
CME Group launched XRP futures in May 2025. They passed $1 billion in open interest within about three months, the fastest of any new CME contract, and options on XRP futures followed in October 2025.
In late August 2026 the shift sped up. Between August 17 and 31, total XRP futures open interest fell 16% while CME open interest rose 36% to 387 million XRP, lifting CME's share from 10% to 17%. Leveraged funds on CME held a net short of about 116 million XRP. By early September, CME had become the largest single venue for XRP futures by open interest.
This matters for reading the heatmap in three ways:
- Offshore clusters are a smaller share of the market: Binance and Bybit still hold the leverage that cascades fastest. A growing part of XRP positioning now sits on CME, where accounts are fully margined and institutional.
- Hedge funds trade differently from retail: Institutional shorts on CME are often hedges or basis trades rather than directional bets. They don't unwind the way retail stop-outs do.
- Regulation moves leverage fast: A March 2026 SEC and CFTC joint interpretation classed XRP as a digital commodity, and leverage built through the spring. When the CLARITY Act failed a Senate cloture vote 49 to 50 on September 15, 2026, XRP dropped about 10% to near $1.30 in one session.
What Did the Biggest XRP Liquidations Reveal?
- February flush: On February 5, XRP fell more than 16% to about $1.29, the worst drop among major tokens that day. About $46 million of XRP positions were liquidated, most of them longs. Funding on Binance then stayed mostly negative into the spring as traders leaned short.
- The August rebound: XRP bottomed just below $1 in mid-August, then rallied about 70% to around $1.70 as shorts were squeezed.
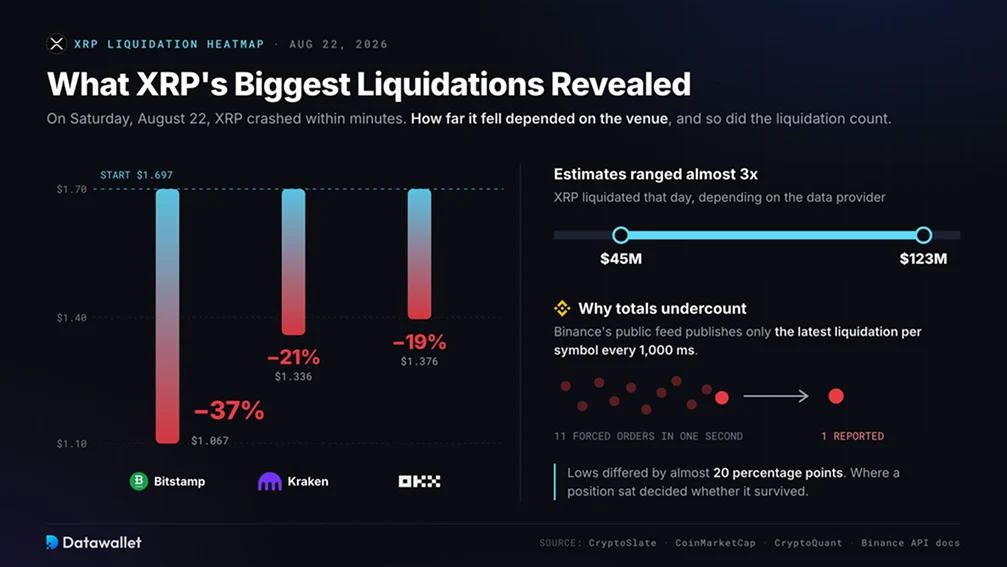
- The weekend wick: On Saturday, August 22, XRP crashed within minutes. Bitstamp printed a 37% drop from $1.697 to $1.067, while Kraken and OKX fell about 20%. It was the largest XRP liquidation day of 2026. Depending on the data provider, estimates of how much was liquidated ranged from about $45 million to $123 million.
Reported liquidation totals disagree this much because exchanges don't report every liquidation. Binance's public liquidation feed publishes only the latest liquidation per symbol every 1,000 milliseconds. During a fast cascade, hundreds of forced orders can collapse into a handful of reported events. That undercounting is why a model of where leverage sits is useful alongside reported totals.
The August 22 wick also showed how much venue matters. Lows differed by almost 20 percentage points between exchanges. Mark-price systems protect perp traders from a wick on a single venue, but only up to a point. When liquidity is thin, which exchange a position sits on can decide whether it survives.
Which Forces Shape XRP Positioning?
- Korean retail flow: XRP out-traded Bitcoin on Upbit for 30 straight days between August 23 and September 21, 2026, yet showed no kimchi premium. Korean spot demand often sets XRP's intraday direction, and offshore perps amplify the move. Datawallet's guide to South Korean crypto exchanges covers Upbit and its rivals.
- Spot ETF demand: US spot XRP ETFs launched in late 2025. They recorded a record weekly inflow of $110.5 million in late August 2026, then flattened near $1.71 billion in cumulative inflows by mid-September. Unleveraged ETF demand can absorb forced selling, but only while it keeps flowing.
- Monthly escrow releases: Ripple releases 1 billion XRP from escrow on the 1st of each month and usually locks 700 to 900 million of it again. Traders often position around the release date, and new clusters tend to form in the days before it.
- Stablecoin liquidity: Ripple's RLUSD stablecoin reached about $2.4 billion in supply by mid-September 2026. That deepens dollar liquidity on the XRP Ledger and gives future XRPL lending markets a native borrowing asset.
- Treasury companies: Evernorth, which holds about 473 million XRP, cleared its SEC registration in August 2026 ahead of a planned Nasdaq listing under the ticker XRPN.
How Should You Read XRP Clusters?
- Separate near and far clusters: Clusters within 5% to 10% of spot are live targets. Clusters that formed at the August cycle low, well below $1.20, are structural levels, not near-term magnets.
- Mark the 1st of the month: Check the 3d view before each escrow release. Leverage that builds ahead of a release often unwinds right after it.
- Watch weekends: Thin weekend books turned a routine dip into a 37% wick on one venue in August. Dense clusters within a few percent of price carry more risk from Friday to Sunday.
- Read Asia hours: Heavy Upbit activity during Korean trading hours often starts the moves that set off offshore clusters.
- Know what's missing: CME futures and options, Korean spot books and spot ETF flows aren't in the model. The model also can't tell a hedge from a directional bet, so a large institutional short may be a basis trade rather than a bet on lower prices.