





 OP
OP TIA
TIA DYDX
DYDX ENA
ENA IMX
IMX JTO
JTO EIGEN
EIGEN APT
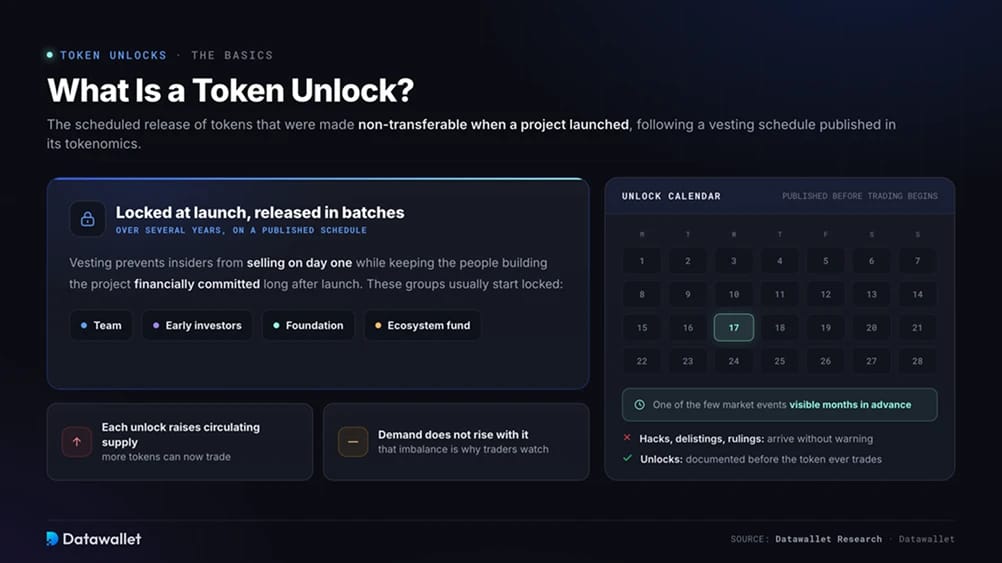
APTWhat Is a Token Unlock?
A token unlock is the scheduled release of tokens made non-transferable when a crypto project launches. Teams, early investors, foundations and ecosystem funds usually receive allocations that remain locked at launch. These tokens are then released in batches over several years according to a vesting schedule published in the project’s tokenomics documents. Vesting prevents insiders from selling on day one while keeping the people building the project financially committed long after launch.
Each unlock increases the circulating supply, but demand does not automatically rise with it. This basic imbalance is why traders monitor unlock calendars closely. Hacks, delistings and regulatory rulings can arrive without warning. Unlocks are documented before a token begins trading, making them one of the few market events visible months in advance.
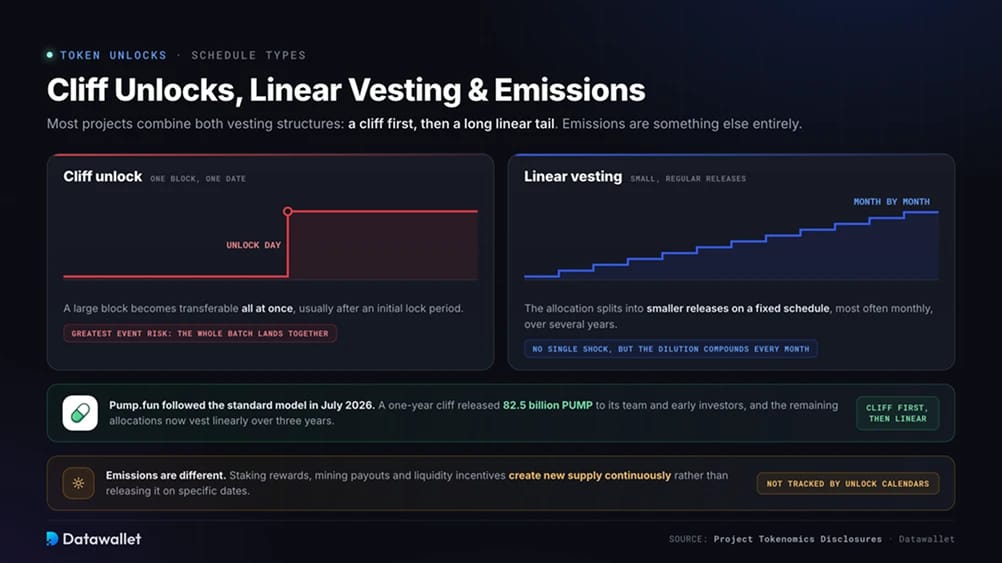
Cliff Unlocks, Linear Vesting and Emissions
A cliff unlock releases a large block of tokens on one date, usually after an initial lock period. Linear vesting divides an allocation into smaller releases on a fixed schedule, most often monthly, and distributes them over several years. Most projects use both structures. In July 2026, Pump.fun followed this standard model when a one-year cliff released 82.5 billion PUMP to its team and early investors. The remaining allocations now vest linearly over three years.
Cliffs create the greatest event risk because the entire batch becomes transferable at once. A linear schedule is less likely to produce a dramatic reaction on any single date, though its steady dilution compounds each month. A token may absorb eleven releases before the twelfth arrives during a weaker market.
Emissions are different. Staking rewards, mining payouts and liquidity incentives continuously create new supply rather than releasing it on specific dates. Unlock calendars, including this one, only track scheduled vesting events.
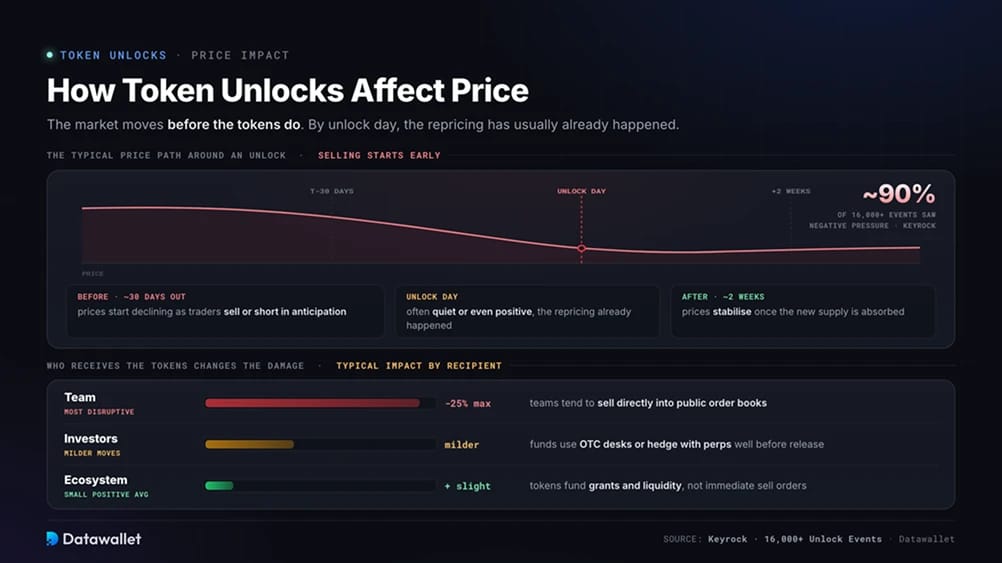
How Token Unlocks Affect Price
Market maker Keyrock analysed more than 16,000 unlock events and found that roughly 90 percent were followed by negative price pressure, regardless of the event’s size or recipient type. Selling often begins early. Prices typically start declining about 30 days before an unlock as traders anticipate the additional supply, then stabilise within roughly two weeks afterwards. By the time the tokens are released, the market has often repriced the asset. As a result, the unlock day itself can be quiet or occasionally positive.
The recipient also influences the impact. Keyrock found that team unlocks were the most disruptive, with drawdowns reaching 25 percent, because teams tend to sell directly into public order books. Investor unlocks caused milder moves. Funds often use over-the-counter desks, where large private trades are arranged off exchange, or hedge through perpetual futures markets well before the release.
Ecosystem unlocks averaged a small positive return because the tokens generally supported grants and liquidity programmes rather than immediate sell orders.
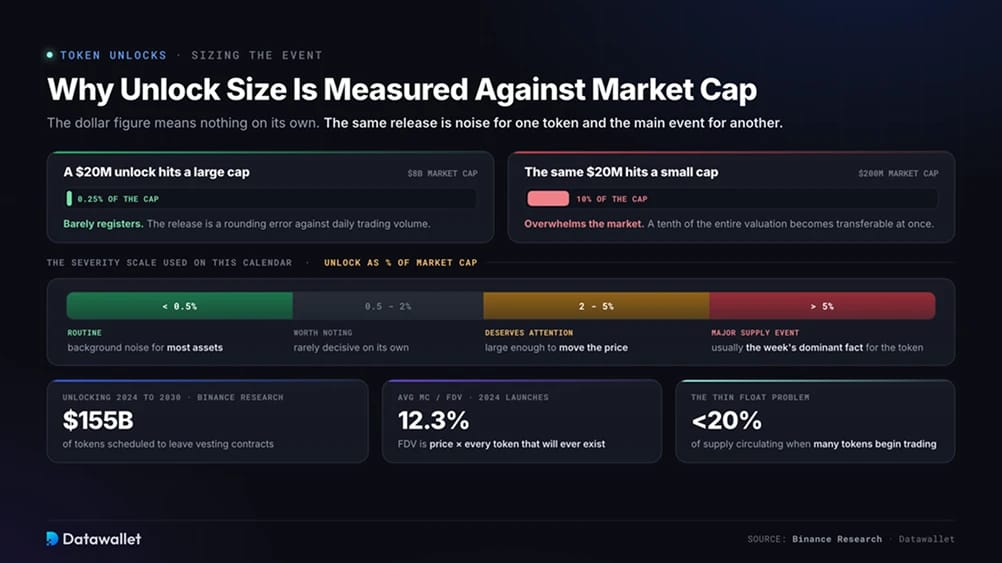
Why Unlock Size Is Measured Against Market Cap
A $20 million release may barely affect a token valued in the billions, yet overwhelm one with a $200 million market cap. For this reason, every event on this calendar is measured as a percentage of the token’s own market capitalisation. An unlock below 0.5 percent is routine. Releases between 2 and 5 percent deserve attention, while anything above 5 percent is usually the most important fact affecting that token during the week.
This ratio has become more important because of the way recent token launches were structured. Many assets begin trading with less than 20 percent of their total supply in circulation. Price discovery therefore occurs on a thin float, meaning only a small share of the supply can trade while the remainder stays in vesting contracts.
Binance Research estimated that roughly $155 billion of tokens would unlock between 2024 and 2030. It also found that tokens launched in 2024 had an average market cap-to-fully-diluted-valuation ratio of just 12.3 percent. Fully diluted valuation, or FDV, is the token price multiplied by every token that will ever exist. The difference between FDV and market cap provides a running measure of the dilution still ahead.
Do Unlocked Tokens Get Sold?
An unlock gives recipients the ability to transfer their tokens. It does not reveal what they intend to do with them. Teams may continue holding their allocations or sell gradually under internal trading policies. Investor tranches often move through OTC desks or were hedged months earlier, meaning the economic selling occurred before the tokens changed hands. Foundation and ecosystem allocations typically pay for grants, exchange listings and market maker loans instead of going directly to a sell order. This is why many large unlocks pass without a visible price reaction.
Vesting schedules can also change. Projects may extend insider lockups, burn unvested allocations or submit revised terms to governance votes. Each entry here reflects the current published schedule, not a guarantee.
After an unlock, on-chain activity offers a clearer signal. Transfers from recipient wallets to exchange deposit addresses show genuine selling intent in a way the calendar date cannot.
How Projects Offset Unlock Pressure
A defining supply-side trend during this cycle is the use of protocol revenue to counter vesting supply. Buybacks purchase tokens from the open market, while burns permanently destroy them. Only a burn, or a buyback followed by one, reduces total supply.
Hyperliquid directs most of its trading fees towards buying back HYPE. Pump.fun divides net revenue between buybacks and operating costs. Even aggressive programmes rarely keep pace with a large cliff unlock, so buybacks are better viewed as price support than a cancellation of incoming supply.
Some projects are also changing the schedules themselves. Several teams have extended insider lockups by at least a year, while others have increased the proportion of supply circulating at launch. Pressure is also growing for more complete disclosure of market maker loan terms, allowing traders to judge how much of the reported float is genuinely available to trade.
Tokens combining transparent schedules with real revenue have absorbed releases much better than those relying on scarcity alone.
Reading Unlocks Alongside Positioning Data
New supply behaves differently in a crowded market than in a quiet one. Before a large release, review funding rates and open interest to measure the leverage built around the token. If an unlock arrives when positioning is stretched, it can trigger forced liquidations worth far more than the tokens released.
The wider market also matters. Altcoin unlocks face much thinner demand when Bitcoin dominance is rising than when the Altcoin Season Index shows capital rotating into smaller assets.
If you hold tokens with active vesting schedules, our crypto portfolio tracker lets you monitor those positions alongside the dates on this page.
Token Unlock FAQs
Do token unlocks always cause a price drop?
No, although the odds lean that way. Keyrock’s study of more than 16,000 events found that around 90 percent produced negative price pressure. Most of the decline occurred during the 30 days before the unlock. Tokens with strong demand, active buyback programmes or recipients that limit their selling can still absorb releases without a visible reaction.
What is the difference between a cliff unlock and linear vesting?
A cliff releases one large block on a single date, typically after a 12-month lock. Linear vesting distributes the allocation in small, regular portions over several years, usually through monthly releases. Cliffs concentrate the supply shock, while linear schedules spread it out. Most projects begin with a cliff and follow it with linear vesting.
When do markets start pricing in an unlock?
Usually about a month beforehand. Research covering thousands of events shows prices beginning to weaken roughly 30 days before the release as traders sell or short in anticipation. They typically stabilise within about two weeks afterwards, once the new supply has been absorbed.
What counts as a large token unlock?
Size must be assessed against the token’s own market cap. An unlock below 0.5 percent is background noise for most assets. Releases equal to 2 to 5 percent of market cap can move the price. Anything above 5 percent is a major supply event that usually dominates trading in the token for several days around the release.
Are staking rewards counted as token unlocks?
No. Staking rewards, mining payouts and liquidity incentives are emissions that create supply continuously rather than on scheduled dates. Unlock calendars cover discrete vesting events from published schedules. Emissions are instead reflected in a token’s inflation rate.
Can a vesting schedule change after launch?
Yes. Teams and foundations can extend lockups, accelerate or pause releases, burn unvested allocations, or submit revised terms to a governance vote. Such amendments occur regularly, so unlock data is updated using each project’s latest published terms rather than remaining fixed at launch.