
.png)
.png)


What Is the NEAR Liquidation Heatmap?
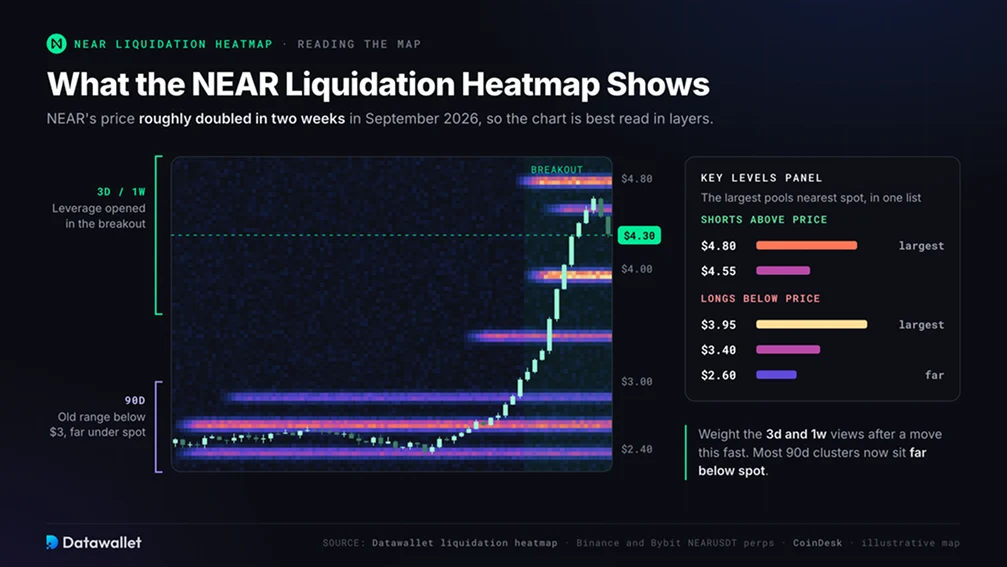
The NEAR liquidation heatmap models where leveraged NEAR/USDT perpetual futures positions on Binance and Bybit would hit their liquidation prices. Short liquidation clusters sit above the NEAR price and would add forced buying if price rose into them. Long liquidation clusters sit below and would add forced selling on the way down.
NEAR's price roughly doubled within two weeks in September 2026, so the chart is best read in layers. The 90-day view shows where leverage built during the range below $3. The 3d and 1w views show positioning opened during the breakout. The key levels panel pulls the largest nearby short and long pools into a single list.
NEAR is the native token of NEAR Protocol, a sharded layer-1 blockchain best known for NEAR Intents, its cross-chain swap system, and for its focus on AI. It is a mid-cap asset with a volatile derivatives market, which makes its liquidation clusters both closer together and quicker to clear than those of the majors.
Why Does NEAR Move So Violently?
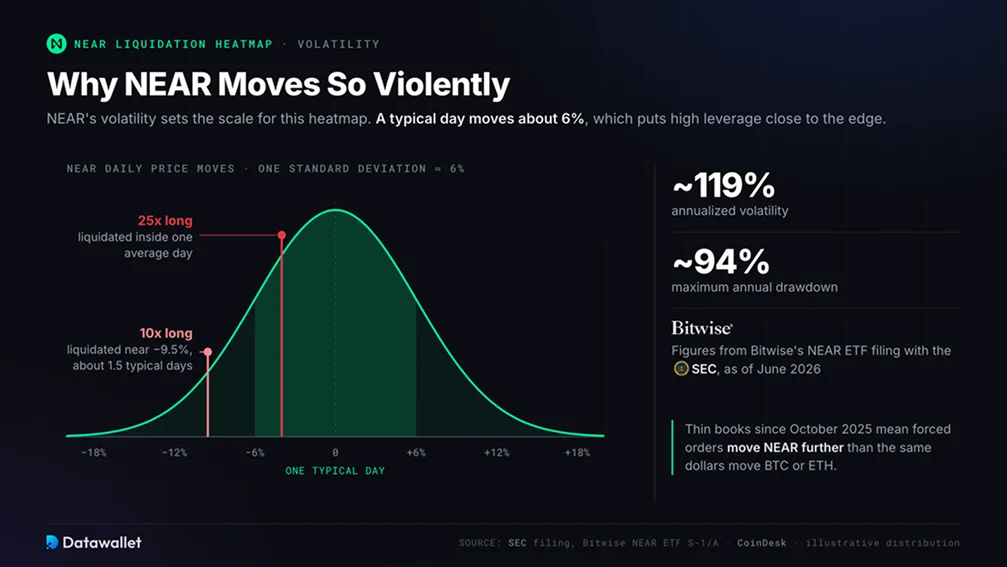
NEAR's volatility sets the scale for everything on this heatmap. An SEC filing for Bitwise's proposed NEAR ETF reported annualized volatility of about 119% and a maximum annual drawdown of about 94% as of June 2026.
That volatility translates directly into liquidation risk:
- A typical daily move is about 6%: At 119% annualized volatility, one standard deviation of daily movement is roughly 6%.
- 10x is not a conservative leverage level: A 10x long is liquidated after about a 9% to 10% decline, well under two typical daily moves. A 25x position is liquidated within a single average day's range.
- Thin books make it worse: Since the October 2025 crash, depth within 1% of price on mid-cap altcoins has stayed well below earlier levels. Forced orders move NEAR further than the same dollar amount would move BTC or ETH.
In practice, NEAR clusters within 10% of spot are near-term targets, not distant structure.
What Drove the September 2026 NEAR Short Squeeze?
NEAR's biggest leverage event of 2026 was a short squeeze in mid-September.
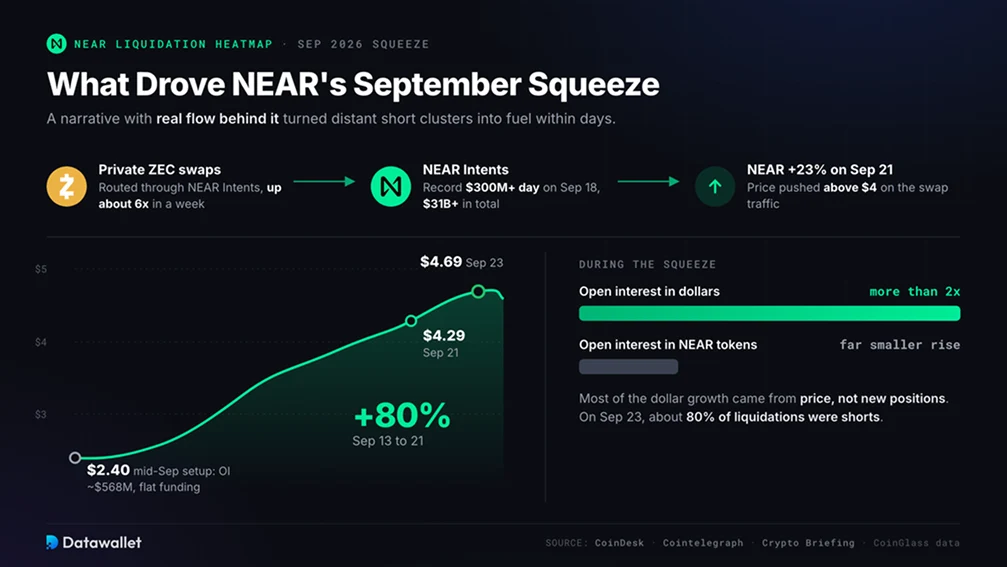
- The setup: In mid-September, NEAR traded near $2.40. The largest long clusters sat below price, and open interest was about $568 million while funding stayed almost flat. Traders were leaning short into a range.
- The catalyst: Private Zcash swaps routed through NEAR Intents surged. Daily ZEC volume flowing through Intents rose about sixfold in a week, and on September 21 NEAR jumped about 23% to above $4 on the Zcash swap traffic. The ZEC side of that trade is tracked on the Zcash liquidation heatmap.
- The squeeze: NEAR gained about 80% between September 13 and 21, then hit $4.69 on September 23, when around 80% of liquidations were shorts. Dollar open interest more than doubled during the move, but open interest measured in NEAR tokens rose far less. Most of the dollar growth came from the price increase, not from new positions.
The lesson is that a narrative with a real flow behind it, here private cross-chain swaps, can turn short clusters that looked distant into fuel within days.
What Drives NEAR Positioning?
- NEAR Intents volume: Cumulative Intents volume passed $31 billion by September 2026, and a single-day record of more than $300 million was set on September 18. Intents activity now directly moves NEAR sentiment.
- The AI narrative: NEAR's work on private AI inference, running on secure NVIDIA hardware, set off a separate squeeze in May 2026, when about $5.8 million of the $6.1 million liquidated in a day were shorts. Datawallet's AI crypto coins guide compares NEAR with other AI-focused networks.
- Lower inflation: NEAR cut annual token issuance from 5% to 2.5% in October 2025. With the original token allocations fully unlocked, inflation is now the main source of new supply.
- Pending ETFs and treasury buyers: Grayscale filed to convert its NEAR trust into an ETF in January 2026, and Bitwise's staking NEAR ETF was still awaiting launch in September 2026. The SovereignAI treasury company held about 53.9 million NEAR, roughly 4% of supply, by November 2025.
- DeFi risk: In April 2026, Rhea Finance, NEAR's largest DeFi hub, was drained through an oracle attack that used fake tokens as collateral. Events like this hit NEAR sentiment and leverage without warning.
How Should You Read NEAR Clusters Responsibly?
- Use percentage distance: With typical daily moves around 6%, clusters within 10% of spot are live. Anything beyond 25% is structure on the 1m and 90d views.
- Follow Intents and ZEC flows: Spikes in Intents volume, especially private ZEC swaps, have come before NEAR's biggest squeezes.
- Compare token and dollar open interest: If dollar open interest rises much faster than token-denominated open interest, the rally is being carried by price, not by new leverage. The resulting clusters are thinner than they look.
- Watch funding at extremes: Flat or negative funding under heavy short clusters is squeeze fuel. Funding running hot after a big rally marks crowded longs.
- Know what's missing: Onchain lending on NEAR, other exchanges and the spot flows routed through Intents aren't in the model. The heatmap shows where pressure sits, not which way price will break.