
Top 10 Bitcoin Statistics and Trends
1. Bitcoin Trades Near $85,300 After a 46% Recovery From June Lows
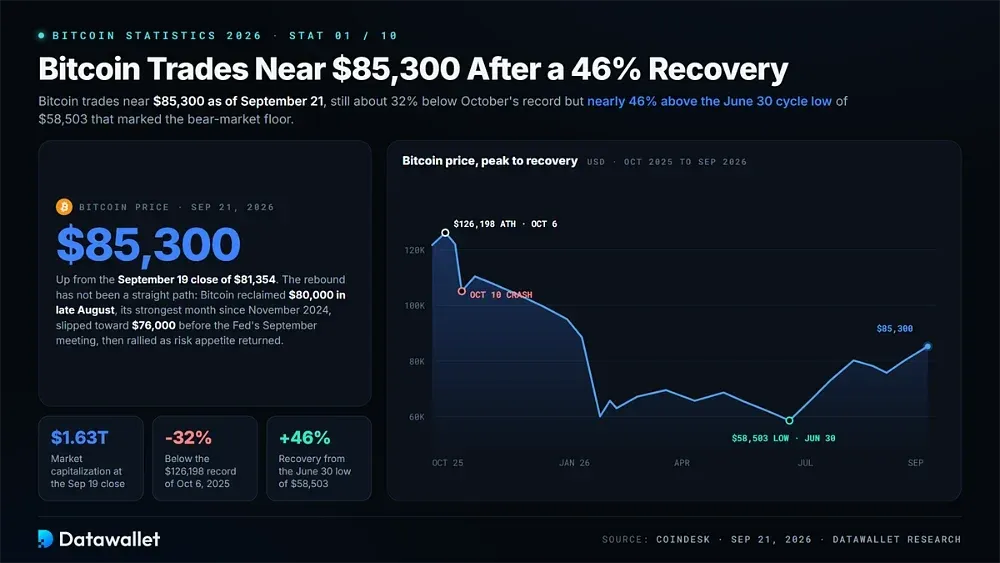
Bitcoin is trading near $85,300 according to CoinDesk as of September 21, 2026, up from its September 19 closing level of $81,354, when market capitalization stood at roughly $1.63 trillion. The asset remains about 32% below its October 6, 2025 record of $126,198. It has recovered nearly 46% from the June 30 cycle low of $58,503 that marked this bear market's floor.
That recovery has not followed a straight path. Bitcoin reclaimed $80,000 in late August during its strongest monthly performance since November 2024, then retreated toward $76,000 ahead of the Federal Reserve's September meeting. Prices subsequently rallied as risk appetite returned. Traders can follow live levels on our Bitcoin price page.
Valuation models place the current price zone in neutral territory, between the overheated bands of late 2025 and the historical accumulation zones reached in February 2026. Our Bitcoin rainbow chart shows where today's price sits across those long-term logarithmic regression bands.
2. The 52% Drawdown Ranks as Bitcoin's Mildest Bear Market
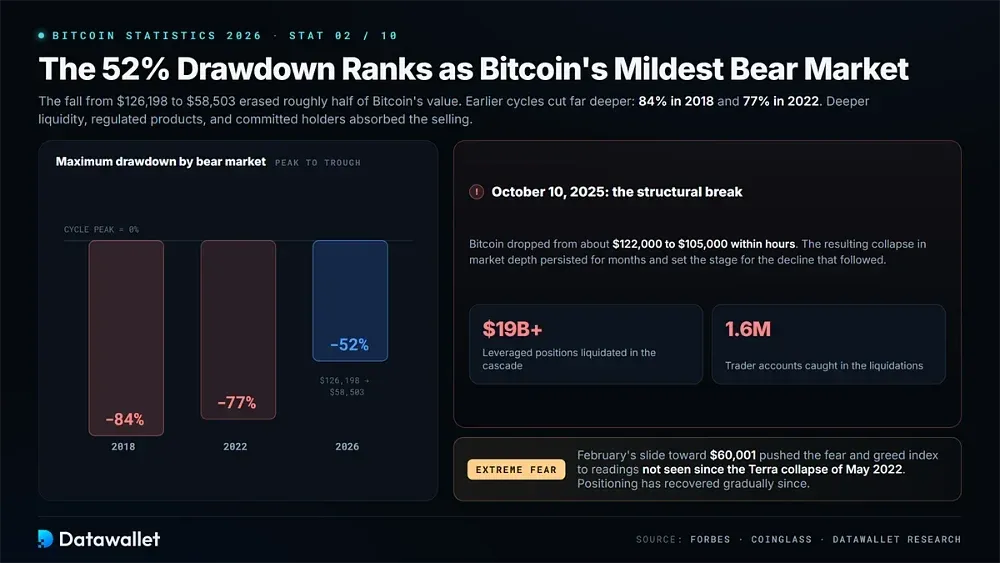
Bitcoin fell from $126,198 to $58,503, producing a maximum drawdown of approximately 52%. Earlier bear markets were substantially deeper: the 2018 decline erased 84% of Bitcoin's value, while the 2022 cycle ended 77% below its peak. Greater market liquidity and regulated investment products helped absorb selling pressure, supported by committed long-term holders.
The initial structural break occurred on October 10, 2025. Bitcoin dropped from approximately $122,000 to $105,000 within hours, triggering the liquidation of more than $19 billion in leveraged positions across over 1.6 million trader accounts.
The resulting collapse in market depth persisted for months. Our analysis of the October 10 crypto crash examines how the liquidation cascade developed and affected subsequent trading conditions.
Market sentiment deteriorated further during February's decline toward $60,001. The crypto fear and greed index recorded extreme fear readings not seen since the Terra collapse in May 2022. Positioning and confidence have since recovered gradually, although trading conditions remain uneven.
3. Spot Bitcoin ETF Assets Climbed Back Above $103 Billion
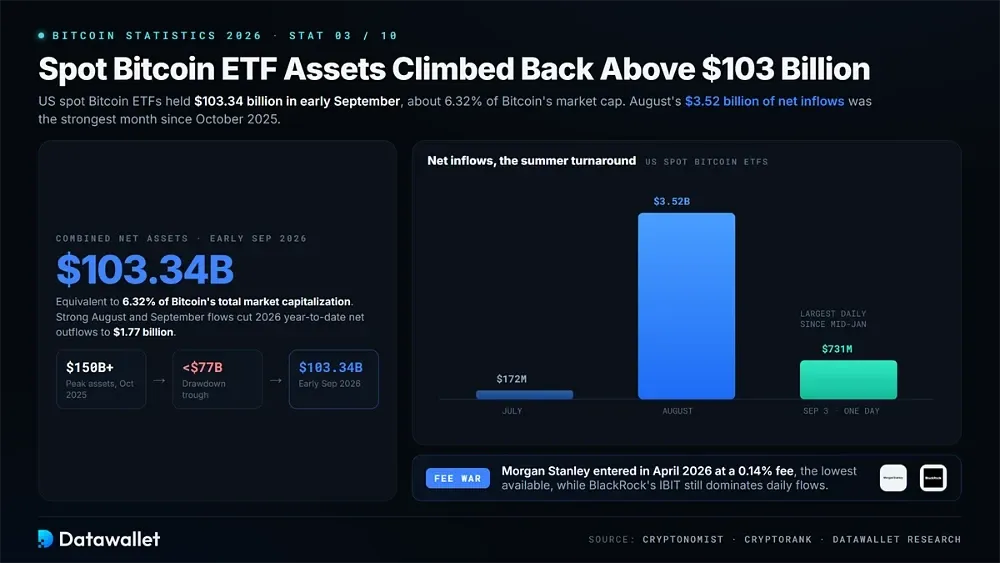
US spot Bitcoin ETFs have recovered much of the asset value lost during the bear market. Combined net assets reached $103.34 billion in early September, equivalent to approximately 6.32% of Bitcoin's total market capitalization. The sector had exceeded $150 billion in October 2025 before assets fell below $77 billion during the drawdown.
August brought a substantial improvement in fund flows. Spot ETFs attracted $3.52 billion in net inflows, their strongest monthly result since October 2025 and a sharp increase from July's $172 million. This reduced year-to-date net outflows for 2026 to $1.77 billion. September then began with a $731 million single-day inflow on the 3rd, the largest daily total since mid-January.
Competition among issuers has also increased. BlackRock's IBIT continues to dominate daily flows, but Morgan Stanley entered the market in April 2026 with a 0.14% fee, the lowest available, putting pressure on established funds. Our Bitcoin ETF tracker provides real-time monitoring of daily flows, assets, and issuer fee schedules.
4. Strategy Holds 845,050 BTC but Broke Its Never-Sell Pledge
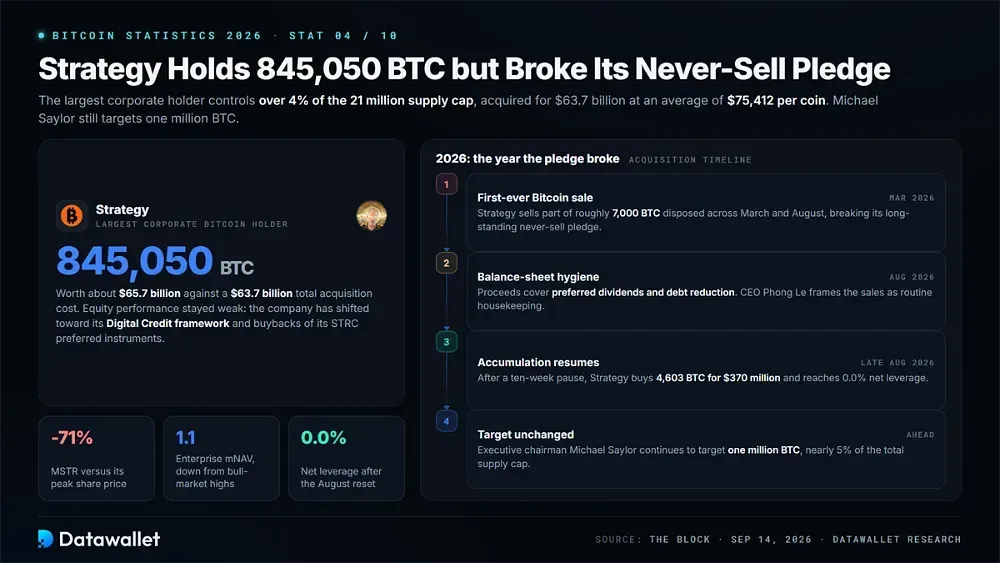
Strategy remains the largest corporate Bitcoin holder, with 845,050 BTC valued at approximately $65.7 billion. Its total acquisition cost stands at $63.7 billion, or an average of $75,412 per coin. The position exceeds 4% of Bitcoin's 21 million supply cap, and executive chairman Michael Saylor continues to target one million BTC.
The company's accumulation strategy changed in 2026 when it sold roughly 7,000 BTC across March and August. These were Strategy's first-ever Bitcoin sales, breaking its long-standing never-sell pledge. The proceeds were used to cover preferred dividends and reduce debt. CEO Phong Le described the transactions as balance-sheet hygiene.
Accumulation resumed in late August after a ten-week pause, with Strategy purchasing 4,603 BTC for $370 million and reaching 0.0% net leverage. Its equity performance has remained weak, however. MSTR trades approximately 71% below its peak, while enterprise mNAV has fallen to just 1.1.
The company has consequently shifted toward its Digital Credit framework and preferred-instrument buybacks. Our guide to STRC explains the yield-bearing preferred stock now central to Strategy's capital structure.
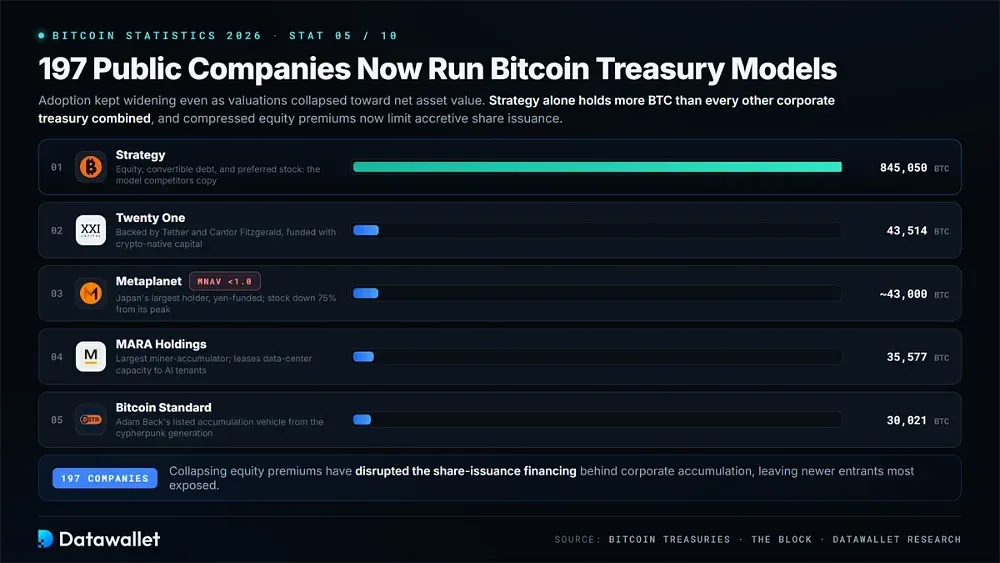
5. 197 Public Companies Now Run Bitcoin Treasury Models
Corporate Bitcoin treasury adoption has continued despite substantial pressure on company valuations. Bitcoin Treasuries data cited by The Block shows that 197 public companies have adopted some form of Bitcoin acquisition model. Collapsing equity premiums have disrupted the share-issuance strategy that previously financed accumulation, leaving newer entrants particularly exposed.
The Largest Corporate Bitcoin Treasuries and What Changed in 2026:
- Strategy Dominance: Strategy holds 845,050 BTC, more than every other corporate treasury combined. Its approach to raising capital through equity, convertible debt, and preferred stock remains the model followed by competing treasury companies.
- Twenty One: Backed by Tether and Cantor Fitzgerald, Twenty One ranks second with 43,514 BTC. Its accumulation strategy relies on crypto-native capital rather than the convertible-debt financing that drove Strategy's original expansion.
- Metaplanet: Japan's largest corporate Bitcoin holder owns approximately 43,000 BTC following an aggressive accumulation program funded in yen. Its stock declined 75%, while its mNAV briefly fell below 1.0, leaving the company trading at less than the value of its Bitcoin holdings.
- MARA Holdings: The largest miner-accumulator holds 35,577 BTC. MARA retains mined coins to offset shrinking block rewards while leasing data-center capacity to artificial intelligence tenants, providing an additional revenue stream.
- Bitcoin Standard: Adam Back's Bitcoin Standard Treasury Company holds 30,021 BTC, placing it fifth among public corporate holders and establishing a publicly listed Bitcoin accumulation vehicle associated with the cypherpunk generation.
- Premium Collapse: Market capitalizations across the treasury sector have compressed toward net asset value, limiting opportunities for accretive share issuance. Our Bitcoin treasury tracker monitors the positions of corporate holders daily.
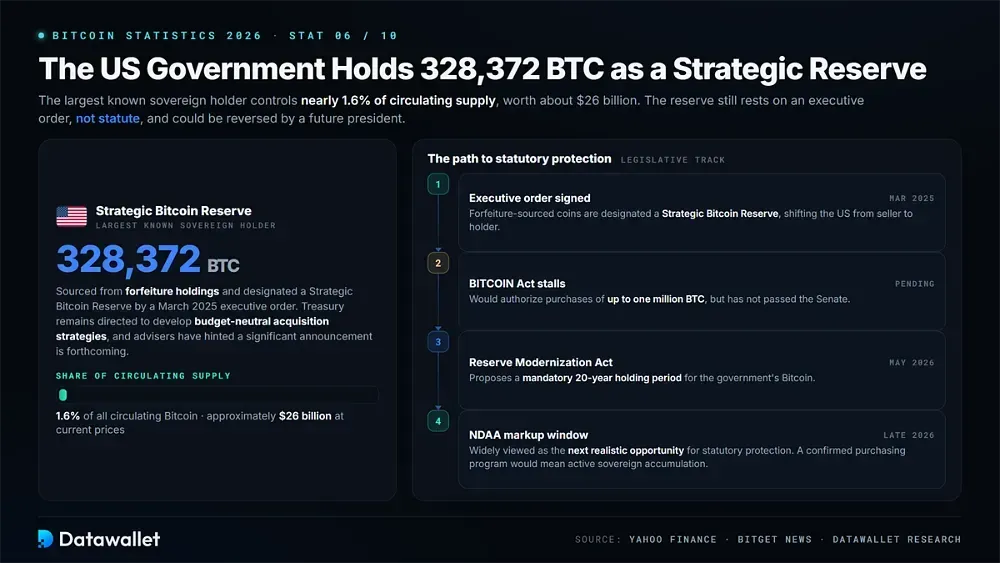
6. The US Government Holds 328,372 BTC as a Strategic Reserve
The United States formalized its Bitcoin holdings as a strategic reserve during this cycle. Its estimated 328,372 BTC represent nearly 1.6% of circulating supply and are worth approximately $26 billion at current prices. This makes the US the largest known sovereign Bitcoin holder. A March 2025 executive order designated the government's forfeiture-sourced coins as a Strategic Bitcoin Reserve.
The reserve has not yet received statutory protection. The BITCOIN Act, which would authorize purchases of up to one million BTC, has not passed the Senate. Meanwhile, the American Reserve Modernization Act, introduced in May 2026, proposes a mandatory 20-year holding period. Without legislation, the reserve remains established by executive order and could be reversed by a future president.
The late-2026 National Defense Authorization Act (NDAA) markup is widely viewed as the next realistic opportunity to establish statutory protection. White House digital asset advisers have suggested that a significant reserve announcement is forthcoming. Treasury also remains directed to develop budget-neutral acquisition strategies.
A confirmed federal purchasing program would shift the government's role from passive Bitcoin custody to active sovereign accumulation.
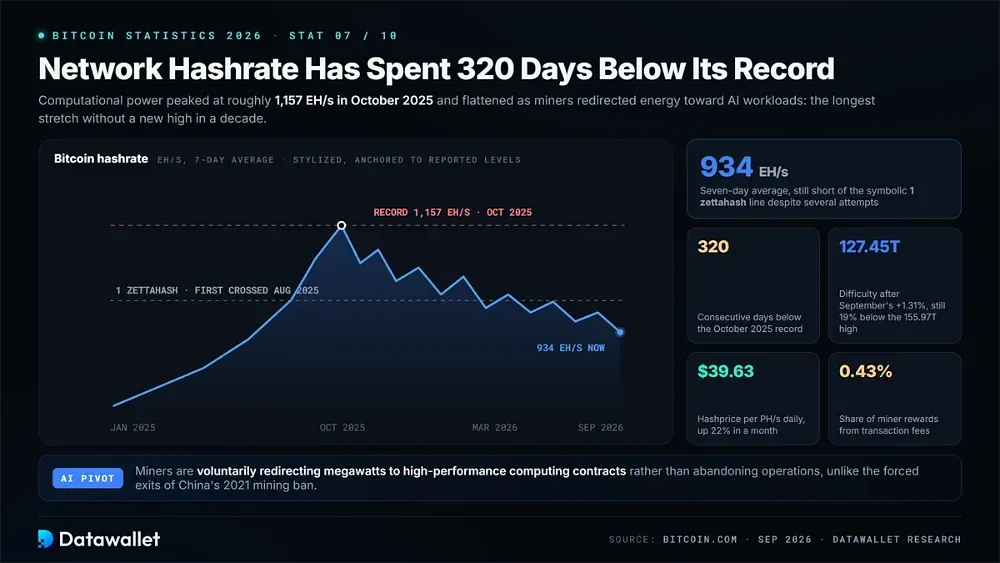
7. Network Hashrate Has Spent 320 Days Below Its Record
Bitcoin's computational power has stopped expanding after several years of sustained growth. Hashrate peaked alongside the asset's price in late 2025, then flattened as mining operators began redirecting energy infrastructure toward artificial intelligence workloads that offered more attractive returns than block production.
The Key Mining Metrics Defining Bitcoin's Network in September 2026:
- Record Drought: Hashrate reached approximately 1,157 EH/s in October 2025 and has remained below that record for 320 consecutive days, the longest stretch without a new high in a decade.
- Current Level: The seven-day average stands near 934 EH/s. Despite several attempts, it has failed to regain the symbolic 1 zettahash threshold that Bitcoin first crossed in August 2025.
- Difficulty Reset: Mining difficulty reached 127.45 trillion following September's 1.31% increase. It remains approximately 19% below the all-time high of 155.97 trillion recorded in October 2025.
- Hashprice Relief: Revenue per petahash increased 22% over one month to $39.63 per day as Bitcoin's price recovered. This eased pressure on operators after mining profitability reached fourteen-month lows earlier in 2026.
- Fee Drought: Transaction fees accounted for just 0.43% of miner rewards in recent sessions. The industry therefore remains almost entirely dependent on the block subsidy and spot price appreciation.
- AI Pivot: Miners have voluntarily redirected megawatts toward high-performance computing contracts rather than simply abandoning operations. This distinguishes the current hashrate decline from China's 2021 mining ban and earlier forced industry exits.
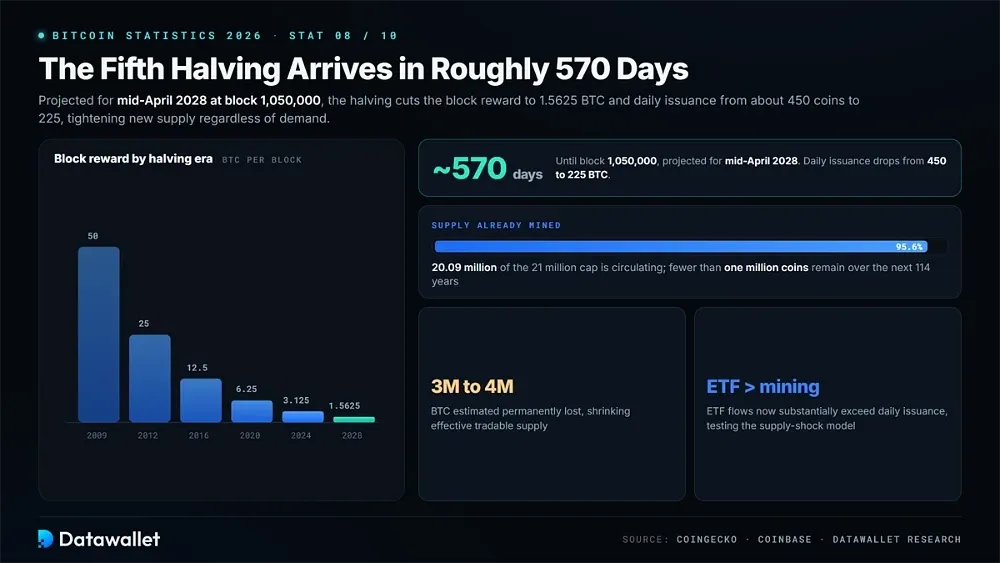
8. The Fifth Halving Arrives in Roughly 570 Days
Bitcoin's fifth halving is projected to occur in mid-April 2028 at block 1,050,000. The event will reduce the block reward from 3.125 BTC to 1.5625 BTC, cutting daily issuance from approximately 450 coins to 225. The reduction will tighten the flow of new Bitcoin entering circulation, regardless of prevailing demand.
The network is approaching its maximum supply. Approximately 20.09 million BTC are circulating, accounting for more than 95.6% of the 21 million cap. Fewer than one million coins remain to be mined over the next 114 years. Estimates also suggest that three to four million BTC have been permanently lost, reducing the effective tradable supply.
Whether halvings retain their historical influence on market prices remains an open question. ETF flows now substantially exceed daily Bitcoin issuance, prompting some analysts to argue that institutional demand cycles have weakened the traditional supply-shock model. Our Bitcoin halving countdown tracks the block-by-block schedule ahead of the 2028 event.
9. An Estimated 365 Million People Own Bitcoin Worldwide
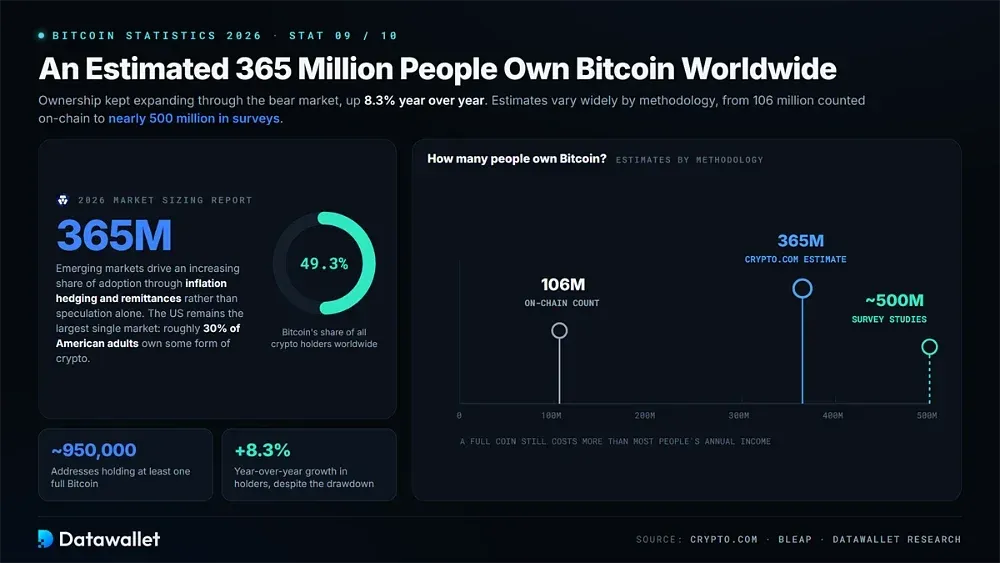
Bitcoin ownership continued to expand during the bear market. Crypto.com's 2026 Market Sizing Report estimates that 365 million people own Bitcoin, an 8.3% year-over-year increase. That represents 49.3% of all cryptocurrency holders worldwide. Estimates differ substantially by methodology, with on-chain counts as low as 106 million and survey-based studies approaching 500 million.
Ownership of a full coin is far less common. Approximately 950,000 addresses hold at least one Bitcoin, which still costs more than most people's annual income despite the drawdown. The United States remains the largest individual market, with roughly 30% of American adults owning some form of cryptocurrency.
Emerging markets are contributing increasingly to regional adoption, driven by practical uses such as inflation hedging and remittances rather than speculation alone. Our crypto adoption statistics report examines country-level rankings and demographic patterns, with detailed growth rates across every major region.
10. Nearly 60% of Bitcoin Supply Hasn't Moved in Over a Year
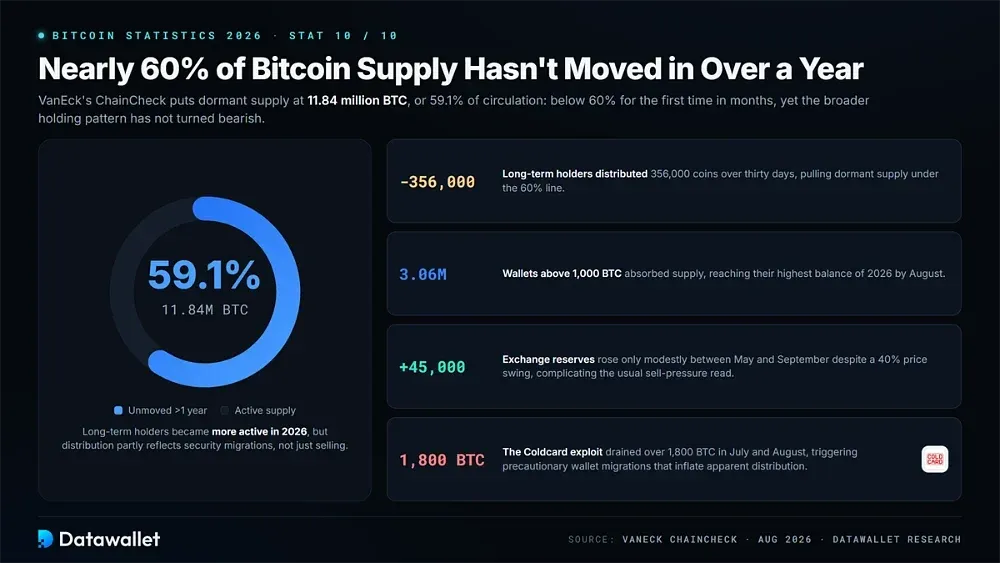
Long-term Bitcoin holders became more active during 2026, although the broader pattern has not turned bearish. VanEck's ChainCheck data places the supply untouched for more than a year at 11.84 million BTC, equivalent to 59.1% of circulating supply. This fell below 60% for the first time in months after long-term holders distributed 356,000 coins over thirty days.
Large addresses absorbed some of that supply. Wallets holding more than 1,000 BTC accumulated 3.06 million coins by August, their highest balance of 2026. Exchange reserves, meanwhile, increased by only approximately 45,000 BTC between May and September despite a 40% price swing. This complicates the traditional interpretation of exchange balances as a signal of selling pressure.
Security concerns also contributed to on-chain movement. The Coldcard exploit, which drained more than 1,800 BTC during July and August, exposed weaknesses in random number generation. Holders responded with precautionary wallet migrations, increasing apparent distribution without necessarily indicating sales. Our roundup of the best crypto wallets covers the hardware and software options holders trust following this year's incidents.
What ETF Ownership Means for Bitcoin Investors
Spot Bitcoin exchange-traded products provide price exposure through securities rather than coins held in a personal wallet. The underlying Bitcoin remains with the trust's custody arrangements, while investors own exchange-traded shares. This distinction matters when comparing institutional adoption figures with the number of people able to transact directly on-chain.
ETF assets and inflows also require careful interpretation. Asset values change with Bitcoin's price as well as investor subscriptions and redemptions, so rising assets do not necessarily represent equivalent new purchases. The SEC's investor bulletin also explains how share prices can diverge from underlying Bitcoin prices.
Custody introduces another difference. ETF shareholders rely on the product's custody arrangements and pay sponsor fees, whereas direct Bitcoin holders can manage access through their own private keys. The SEC's custody guidance explains the considerations involved in self-custody and third-party custody. Neither approach eliminates Bitcoin's underlying price volatility.

Why Bitcoin's 2026 Bear Market Is Different
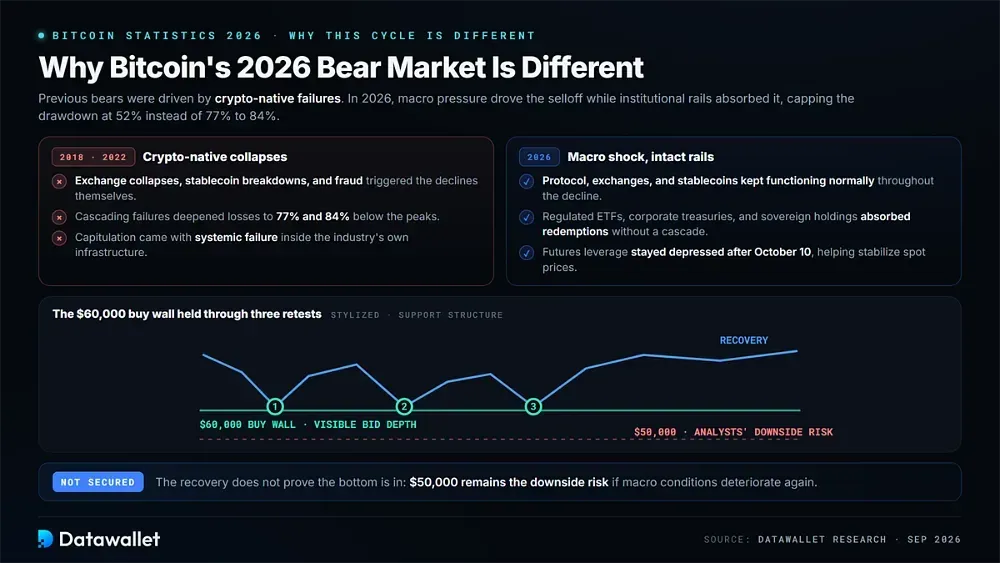
Previous Bitcoin bear markets were associated with crypto-native failures, including exchange collapses, stablecoin breakdowns, and fraud. The 2026 decline followed a different pattern. Bitcoin's protocol continued functioning normally, as did exchanges and stablecoins.
Macroeconomic pressures drove the selloff, while institutional market infrastructure helped limit its severity. Together, these conditions explain why the cycle's maximum drawdown reached 52%, rather than the 77% to 84% declines recorded in earlier bear markets.
Institutional Rails Absorbed the Selling
The market's expanded institutional infrastructure faced its first major bear-market test. Regulated ETFs and corporate treasuries provided pools of committed capital, alongside sovereign Bitcoin holdings. These helped absorb institutional redemptions without triggering a cascading failure. A visible buy wall near $60,000 held through three separate retests, unlike the conditions observed during previous capitulation events.
Leverage also remained considerably lower following October 10. Aggregate futures positioning declined steadily after the crash and stayed depressed as traders who had suffered losses avoided margin. Reduced leveraged exposure helped stabilize spot prices. Our Bitcoin open interest tracker and Bitcoin liquidation heatmap show current positioning and areas where forced selling could become concentrated.
The recovery does not establish that the cycle bottom is secure. Analysts continue to identify $50,000 as a downside risk if macroeconomic conditions deteriorate again. Nevertheless, compared with the severe market unwinds documented in our history of crypto crashes, the 2026 decline demonstrated a greater capacity to absorb selling pressure without systemic failure.
Macro Shocks Replaced Crypto-Native Failures
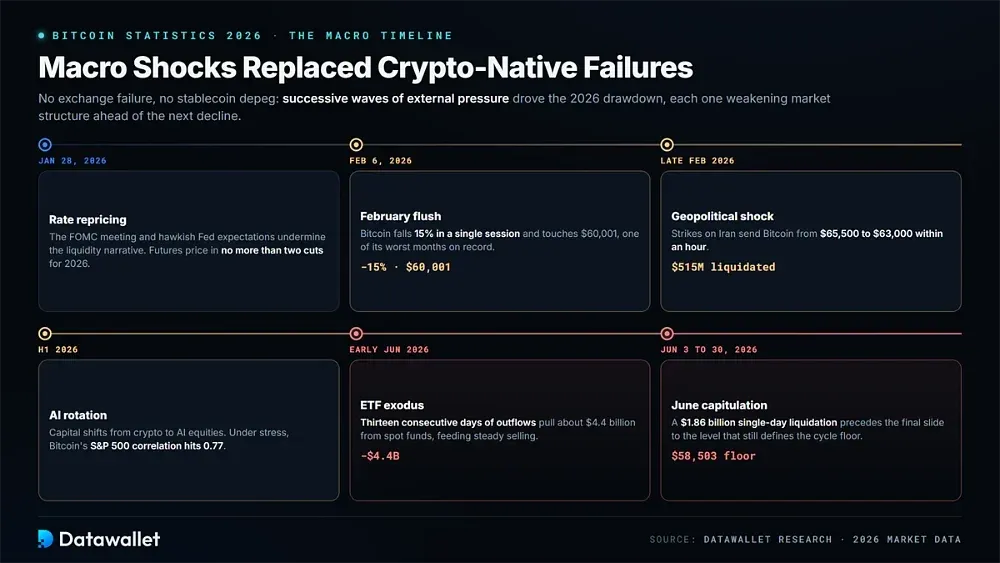
External economic pressures arrived in successive waves during 2026, weakening Bitcoin's market structure ahead of each subsequent decline. Neither an exchange failure nor a stablecoin depeg drove the downturn. Instead, changes in traditional financial markets and investor risk appetite determined much of the price action.
The Macro Timeline That Drove Bitcoin's 2026 Drawdown:
- Rate Repricing: The January 28 FOMC meeting, combined with expectations of hawkish Federal Reserve leadership, undermined the liquidity-expansion narrative. Futures markets subsequently priced in no more than two rate cuts during 2026.
- February Flush: On February 6, Bitcoin fell 15% in a single session and touched $60,001, contributing to one of the worst monthly performances in its recorded trading history.
- Geopolitical Shock: Strikes on Iran in late February sent Bitcoin from $65,500 to $63,000 within an hour. More than $515 million in leveraged positions were liquidated over the course of a day.
- ETF Exodus: Thirteen consecutive days of spot ETF outflows in early June removed approximately $4.4 billion from funds, translating redemptions into sustained selling pressure on the underlying market.
- AI Rotation: Capital shifted from cryptocurrency markets toward artificial intelligence equities throughout the first half of 2026. During periods of market stress, Bitcoin's correlation with the S&P 500 reached 0.77.
- June Capitulation: A single-day liquidation event totaling $1.86 billion on June 3 preceded Bitcoin's final decline to $58,503, the price level that has since defined the cycle floor.
Quantum Security Became Bitcoin's Defining Technical Debate
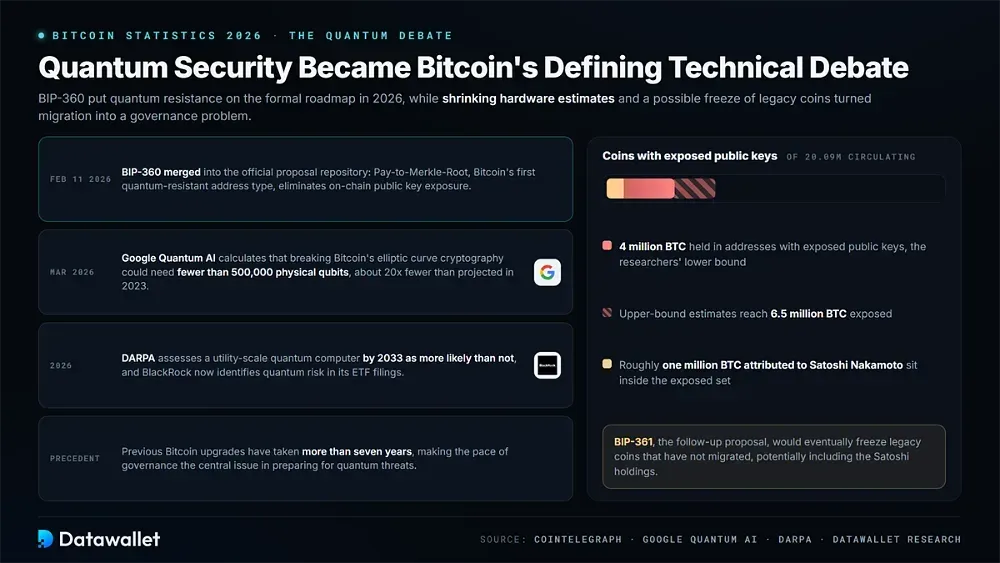
Quantum computing became a formal part of Bitcoin's technical roadmap in 2026. On February 11, BIP-360 was merged into the official Bitcoin Improvement Proposal repository. The proposal introduces Pay-to-Merkle-Root, Bitcoin's first quantum-resistant address type, designed to eliminate on-chain public key exposure.
Recent hardware estimates have intensified the debate. A Google Quantum AI paper published in March 2026 calculated that breaking Bitcoin's elliptic curve cryptography could require fewer than 500,000 physical qubits, approximately twenty times fewer than projected in 2023. DARPA, meanwhile, assessed the development of a utility-scale quantum computer by 2033 as more likely than not. BlackRock has also begun identifying quantum risk in its ETF filings.
Implementing a migration presents governance challenges beyond the cryptography itself. Researchers estimate that between four million and 6.5 million BTC are held in addresses with exposed public keys. A follow-up proposal, BIP-361, would eventually freeze legacy coins that have not migrated, potentially including roughly one million BTC attributed to Satoshi Nakamoto.
Previous Bitcoin upgrades have taken more than seven years, making the pace of governance a central issue in preparing for quantum threats.
What to Watch Through the End of 2026
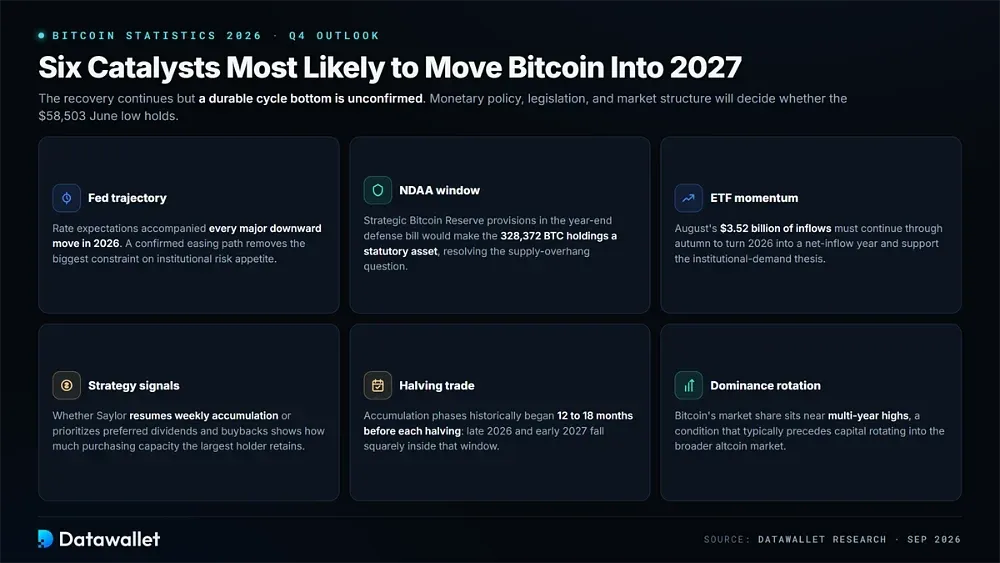
Bitcoin enters the fourth quarter with its recovery continuing, although a durable cycle bottom has not yet been confirmed. Developments in monetary policy and legislation, alongside changes in market structure, will influence whether the June low holds.
Six Catalysts Most Likely to Move Bitcoin Into 2027:
- Fed Trajectory: Changes in interest-rate expectations accompanied every major downward move in 2026. A confirmed path toward monetary easing would remove a significant constraint on institutional risk appetite.
- NDAA Window: Inclusion of Strategic Bitcoin Reserve provisions in the year-end defense bill would establish the government's 328,372 BTC holdings as a statutory national asset, permanently resolving the associated supply-overhang question.
- ETF Momentum: August's $3.52 billion in net inflows would need to continue through autumn to turn 2026 into a net-inflow year and support the institutional-demand thesis underlying the recovery.
- Strategy Signals: Saylor's decision to resume weekly Bitcoin accumulation or prioritize preferred dividends and buybacks will indicate how much purchasing capacity remains available to the largest corporate holder.
- Halving Trade: Historically, accumulation phases began twelve to eighteen months before each halving. Late 2026 and early 2027 therefore fall within the period traders typically anticipate ahead of the next event.
- Dominance Rotation: Bitcoin's market share remains near multi-year highs, a condition that would typically precede an altcoin rotation. Our Bitcoin dominance chart tracks whether capital begins shifting into the broader cryptocurrency market.
Final Thoughts
Bitcoin's 2026 market performance contrasts sharply with the resilience of its underlying infrastructure. Its price fell by half, treasury company shares suffered substantial losses, and network hashrate stalled. Yet the system continued operating through the downturn without an exchange failure or protocol flaw. The shallowest bear market on record provides further evidence of the market's maturation.
Institutional participation has persisted since the expansion of 2024 and 2025. Spot ETF assets recovered toward $103 billion, while 197 public companies continue operating Bitcoin treasury models. The US government also formalized the largest known sovereign Bitcoin position. Macroeconomic repricing, rather than a broad loss of conviction in the asset itself, drove selling pressure during this cycle.
Several developments will shape Bitcoin's trajectory through the remainder of the decade. The April 2028 halving and congressional decisions concerning the Strategic Bitcoin Reserve will coincide with a major cryptographic migration. Regardless of price movements next quarter, Bitcoin's integration into financial markets, corporate balance sheets, and statutory frameworks continues to deepen.
Our Methodology
This article evaluates Bitcoin's market performance, network conditions, and adoption trajectory as of September 22, 2026. The analysis combines live dashboards and on-chain analytics with fund flow data, corporate disclosures, and primary policy documents.
How the Data Was Compiled:
- Price Data: Spot prices, market capitalization, and drawdown figures were sourced from CoinDesk, Coinbase, and Fortune's daily tracking, then cross-referenced against historical cycle records from Bitcoin Magazine Pro.
- ETF Flows: Daily inflows, monthly totals, and aggregate net asset levels were compiled using SoSoValue and Farside Investors flow tables as reported across financial media.
- Corporate Holdings: Company counts, top-five rankings, and market-cap-to-NAV compression metrics were drawn from Strategy's disclosures, The Block's treasury coverage, and BitcoinTreasuries data.
- Network Metrics: Hashrate, difficulty, hashprice, and fee-share figures were compiled from Hashrate Index, CoinWarz, and mining coverage published by Bitcoin.com News during September 2026.
- On-Chain Analytics: Dormant supply, whale balances, and exchange reserve movements were assessed using VanEck's ChainCheck alongside research from CryptoQuant, Santiment, and Bitfinex Alpha.
- Policy Records: The policy analysis draws on the Strategic Bitcoin Reserve executive order and pending Senate legislation. Official Bitcoin Improvement Proposal repository documentation was also reviewed for the quantum security section.
- Snapshot Caveat: Several figures come from live dashboards or estimates. Exact values will change as Bitcoin prices fluctuate, fund flows settle, and additional corporate or government disclosures become available.